Check out the latest SwapsInfo First Quarter of 202 Review and Transition to RFRs Review: First Quarter of 2023.
Interest Rate Derivatives
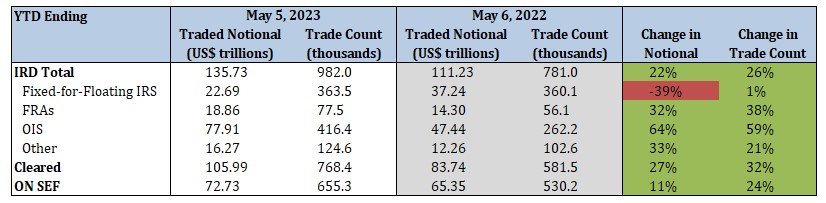
2023 YTD vs. 2022 YTD
- Total IRD traded notional and trade count increased by 22% and 27%, respectively
- Fixed-for-floating IRS traded notional decreased by 39%, while trade count increased by 3%
- FRA traded notional and trade count increased by 38% and 47%, respectively
- OIS traded notional and trade count increased by 64% and 59%, respectively
- 78% of total traded notional was cleared vs. 75% last year
- 54% of total traded notional was executed on SEFs vs. 59% last year
2023 Current Week vs. 2022 Current Week

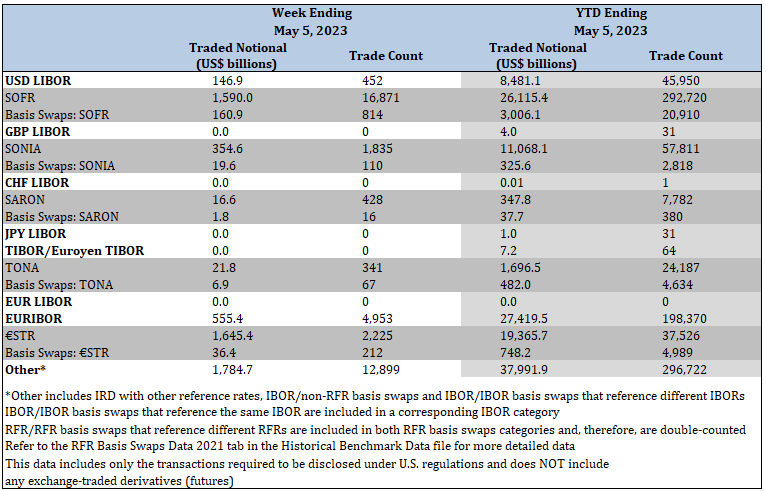
Interest Rate Derivatives: Benchmark Data
YTD Ending May 5, 2023
- SOFR traded notional totaled $29.1 trillion, including $3.0 trillion of basis swaps. Trade count totaled 313.6 thousand, including 20.9 thousand basis swaps
- SONIA traded notional totaled $11.4 trillion, including $325.6 billion of basis swaps. Trade count totaled 60.6 thousand, including 2.8 thousand basis swaps
- SARON traded notional totaled $385.5 billion, including $37.7 billion of basis swaps. Trade count totaled 8.2 thousand, including 380 basis swaps
- TONA traded notional totaled $2.2 trillion, including $482.0 billion of basis swaps. Trade count totaled 28.8 thousand, including 4.6 thousand basis swaps
- €STR traded notional totaled $20.1 trillion, including $748.2 billion of basis swaps. Trade count totaled 42.5 thousand, including 5.0 thousand basis swaps
Click here to view RFR data by product and tenor and RFR historical data
Credit Derivatives Reported under CFTC Regulation
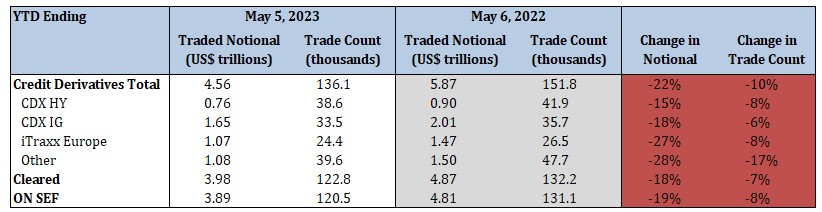
2023 YTD vs. 2022 YTD
- Total credit derivatives traded notional and trade count decreased by 22% and 10%, respectively
- CDX HY traded notional and trade count decreased by 14% and 7%, respectively
- CDX IG traded notional and trade count decreased by 18% and 6%, respectively
- iTraxx Europe traded notional and trade count decreased by 26% and 7%, respectively
- 87% of total traded notional was cleared vs. 83% last year
- 85% of total traded notional was executed on SEFs vs. 82% last year
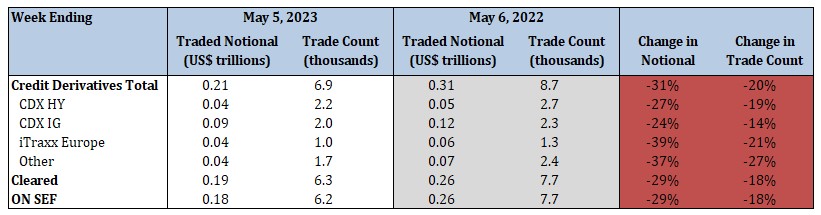
2023 Current Week vs. 2022 Current Week
Credit Derivatives Reported under SEC Regulation
YTD Ending May 5, 2023
- Credit derivatives traded notional totaled $256.5 billion, while trade count totaled 80.6 thousand
- Corporate single-name CDS traded notional totaled $194.3 billion, and trade count was 61.6 thousand
- Sovereign single-name CDS traded notional totaled $50.2 billion, and trade count was 12.7 thousand
- 51% of total traded notional was cleared
