Interest Rate Derivatives
2023 YTD vs. 2022 YTD
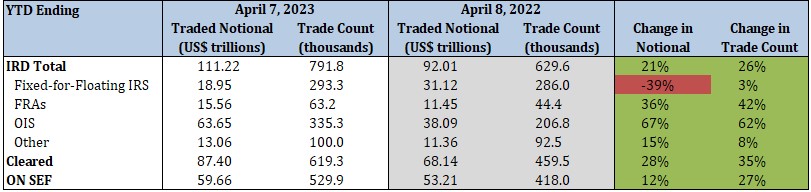
- Total IRD traded notional and trade count increased by 21% and 26%, respectively
- Fixed-for-floating IRS traded notional decreased by 39%, while trade count increased by 3%
- FRA traded notional and trade count increased by 36% and 42%, respectively
- OIS traded notional and trade count increased by 67% and 62%, respectively
- 79% of total traded notional was cleared vs. 74% last year
- 54% of total traded notional was executed on SEFs vs. 58% last year
2023 Current Week vs. 2022 Current Week

Interest Rate Derivatives: Benchmark Data
YTD Ending April 7, 2023
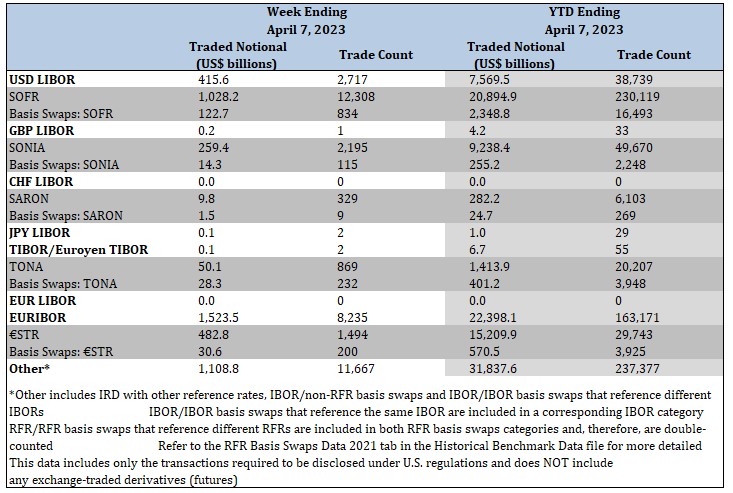
- SOFR traded notional totaled $23.2 trillion, including $2.4 trillion of basis swaps. Trade count totaled 246.6 thousand, including 16.5 thousand basis swaps
- SONIA traded notional totaled $9.5 trillion, including $255.2 billion of basis swaps. Trade count totaled 51.9 thousand, including 2.3 thousand basis swaps
- SARON traded notional totaled $307.0 billion, including $24.7 billion of basis swaps. Trade count totaled 6.4 thousand, including 269 basis swaps
- TONA traded notional totaled $1.8 trillion, including $401.2 billion of basis swaps. Trade count totaled 24.2 thousand, including 4.0 thousand basis swaps
- €STR traded notional totaled $15.8 trillion, including $570.5 billion of basis swaps. Trade count totaled 33.7 thousand, including 3.9 thousand basis swaps
Click here to view RFR data by product and tenor and RFR historical data
Credit Derivatives Reported under CFTC Regulation
2023 YTD vs. 2022 YTD
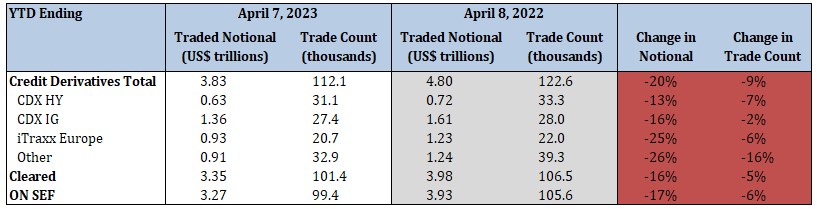
- Total credit derivatives traded notional and trade count decreased by 20% and 9%, respectively
- CDX HY traded notional and trade count decreased by 13% and 7%, respectively
- CDX IG traded notional and trade count decreased by 16% and 2%, respectively
- iTraxx Europe traded notional and trade count decreased by 25% and 6%, respectively
- 87% of total traded notional was cleared vs. 83% last year
- 85% of total traded notional was executed on SEFs vs. 82% last year
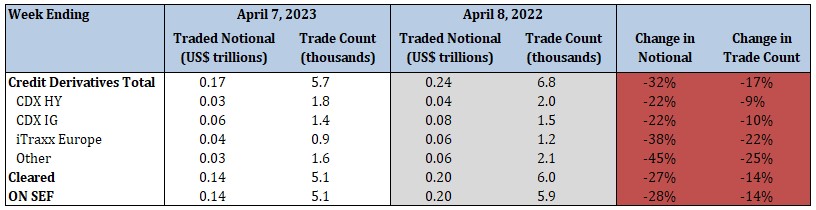
2023 Current Week vs. 2022 Current Week
Credit Derivatives Reported under SEC Regulation
YTD Ending April 7, 2023
- Credit derivatives traded notional totaled $212.5 billion, while trade count totaled 65.6 thousand
- Corporate single-name CDS traded notional totaled $158.9 billion, and trade count was 49.4 thousand
- Sovereign single-name CDS traded notional totaled $43.7 billion, and trade count was 10.8 thousand
- 51% of total traded notional was cleared
