Check out the latest ISDA-Clarus RFR Adoption Indicator: March 2023.
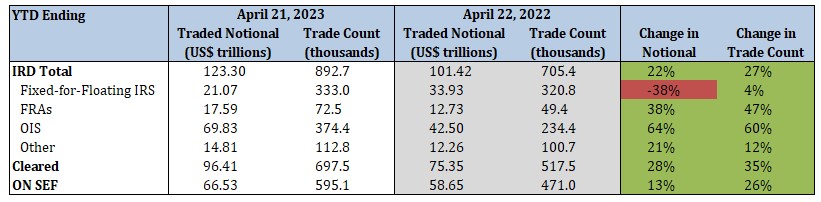
Interest Rate Derivatives
2023 YTD vs. 2022 YTD
- Total IRD traded notional and trade count increased by 22% and 27%, respectively
- Fixed-for-floating IRS traded notional decreased by 38%, while trade count increased by 4%
- FRA traded notional and trade count increased by 38% and 47%, respectively
- OIS traded notional and trade count increased by 64% and 60%, respectively
- 78% of total traded notional was cleared vs. 74% last year
- 54% of total traded notional was executed on SEFs vs. 58% last year
2023 Current Week vs. 2022 Current Week

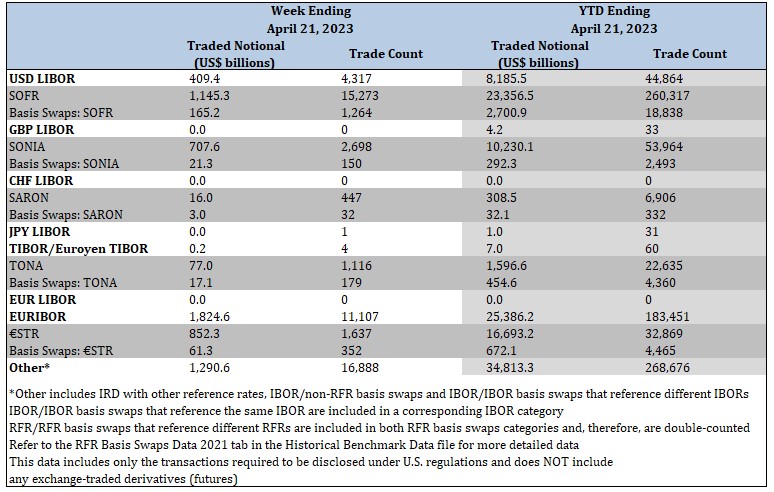
Interest Rate Derivatives: Benchmark Data
YTD Ending April 21 2023
- SOFR traded notional totaled $26.1 trillion, including $2.7 trillion of basis swaps. Trade count totaled 279.2 thousand, including 18.8 thousand basis swaps
- SONIA traded notional totaled $10.5 trillion, including $292.3 billion of basis swaps. Trade count totaled 56.5 thousand, including 2.5 thousand basis swaps
- SARON traded notional totaled $340.6 billion, including $32.1 billion of basis swaps. Trade count totaled 7.2 thousand, including 332 basis swaps
- TONA traded notional totaled $2.1 trillion, including $454.6 billion of basis swaps. Trade count totaled 26.9 thousand, including 4.4 thousand basis swaps
- €STR traded notional totaled $17.4 trillion, including $672.1 billion of basis swaps. Trade count totaled 37.3 thousand, including 4.5 thousand basis swaps
Click here to view RFR data by product and tenor and RFR historical data
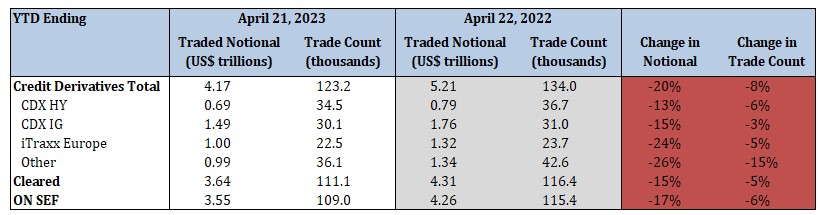
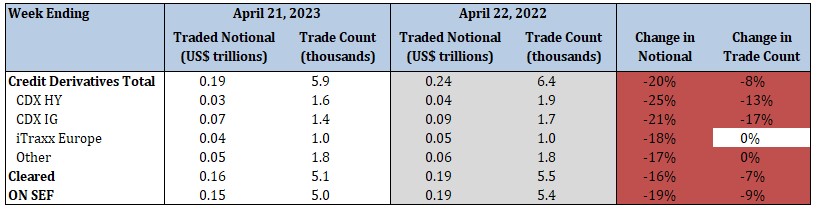
Credit Derivatives Reported under CFTC Regulation
2023 YTD vs. 2022 YTD
- Total credit derivatives traded notional and trade count decreased by 20% and 8%, respectively
- CDX HY traded notional and trade count decreased by 13% and 6%, respectively
- CDX IG traded notional and trade count decreased by 15% and 3%, respectively
- iTraxx Europe traded notional and trade count decreased by 24% and 5%, respectively
- 87% of total traded notional was cleared vs. 83% last year
- 85% of total traded notional was executed on SEFs vs. 82% last year
2023 Current Week vs. 2022 Current Week
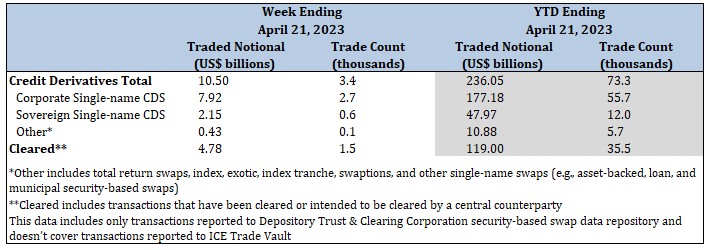
Credit Derivatives Reported under SEC Regulation
YTD Ending April 21, 2023
- Credit derivatives traded notional totaled $236.1 billion, while trade count totaled 73.3 thousand
- Corporate single-name CDS traded notional totaled $177.2 billion, and trade count was 55.7 thousand
- Sovereign single-name CDS traded notional totaled $48.0 billion, and trade count was 12.0 thousand
- 50% of total traded notional was cleared