ISDA has launched a new SwapsInfo page that shows weekly traded notional and trade count for credit derivatives reported under Securities and Exchange Commission regulations. This data includes only security-based swap transactions reported to DTCC security-based swap data repository beginning February 2022. It does not cover security-based transactions reported to ICE Trade Vault and does not include any transactions that are required to be disclosed under Commodity Futures Trading Commission regulations.
Check out the latest ISDA-Clarus RFR Adoption Indicator: February 2023 and Progress on Global Transition to RFRs in Derivatives Markets.
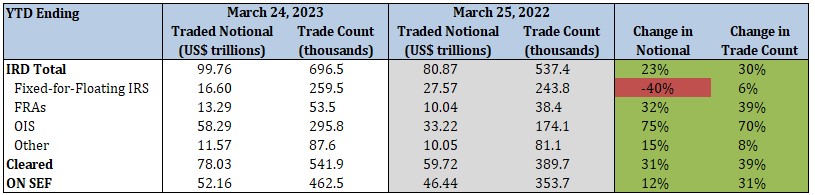
Interest Rate Derivatives
2023 YTD vs. 2022 YTD
- Total IRD traded notional and trade count increased by 23% and 30%, respectively
- Fixed-for-floating IRS traded notional decreased by 40%, while trade count increased by 6%
- FRA traded notional and trade count increased by 32% and 39%, respectively
- OIS traded notional and trade count increased by 75% and 70%, respectively
- 78% of total traded notional was cleared vs. 74% last year
- 52% of total traded notional was executed on SEFs vs. 57% last year
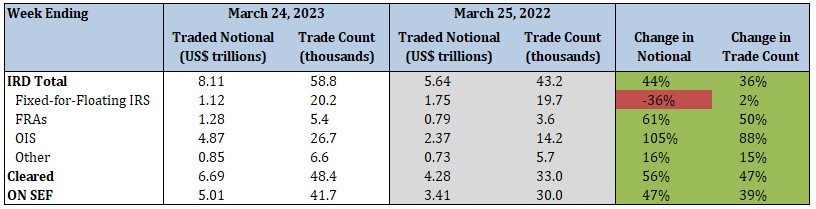
2023 Current Week vs. 2022 Current Week
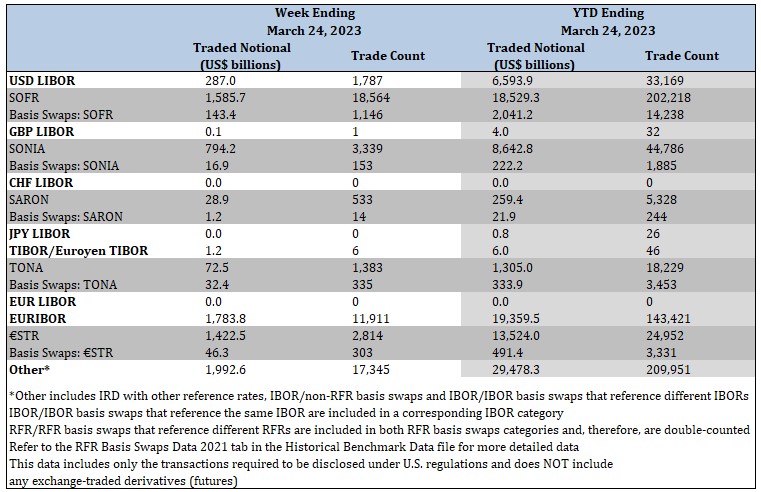
Interest Rate Derivatives: Benchmark Data
YTD Ending March 24, 2023
- SOFR traded notional totaled $20.6 trillion, including $2.0 trillion of basis swaps. Trade count totaled 216.5 thousand, including 14.2 thousand basis swaps
- SONIA traded notional totaled $8.9 trillion, including $222.2 billion of basis swaps. Trade count totaled 46.7 thousand, including 1.9 thousand basis swaps
- SARON traded notional totaled $281.3 billion, including $21.9 billion of basis swaps. Trade count totaled 5.6 thousand, including 244 basis swaps
- TONA traded notional totaled $1.6 trillion, including $333.9 billion of basis swaps. Trade count totaled 21.7 thousand, including 3.5 thousand basis swaps
- €STR traded notional totaled $14.0 trillion, including $491.4 billion of basis swaps. Trade count totaled 28.3 thousand, including 3.3 thousand basis swaps
 Click here to view RFR data by product and tenor and RFR historical data
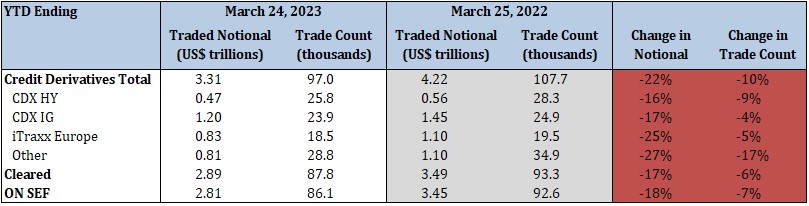
Credit Derivatives Reported under CFTC Regulation
2023 YTD vs. 2022 YTD
- Total credit derivatives traded notional and trade count decreased by 22% and 10%, respectively
- CDX HY traded notional and trade count decreased by 16% and 9%, respectively
- CDX IG traded notional and trade count decreased by 17% and 4%, respectively
- iTraxx Europe traded notional and trade count decreased by 25% and 5%, respectively
- 87% of total traded notional was cleared vs. 83% last year
- 85% of total traded notional was executed on SEFs vs. 82% last year
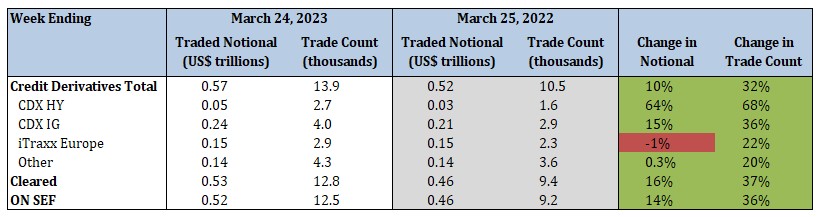
2023 Current Week vs. 2022 Current Week
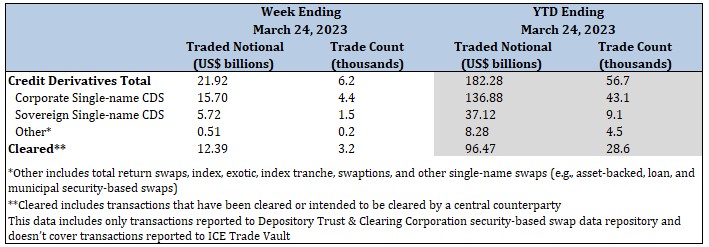
Credit Derivatives Reported under SEC Regulation
YTD Ending March 24, 2023
- Credit derivatives traded notional totaled $182.3 billion, while trade count totaled 56.7 thousand
- Corporate single-name CDS traded notional totaled $136.9 billion, and trade count was 43.1 thousand
- Sovereign single-name CDS traded notional totaled $37.1 billion, and trade count was 9.1 thousand
- 53% of total traded notional was cleared