Summary
ISDA SwapsInfo provides a wealth of information on the OTC derivatives markets, ranging from daily volume-weighted average prices for certain swaps, to weekly market risk activity for CDS and outstanding notionals and trade count for the different types of interest rate contracts.
In this space, we will take a periodic look at the data to discern key trends. How, for example, has the average daily trade size of certain interest rate derivatives contracts changed? What are the current trends in single-name CDS versus index market risk transaction activity?
This month we focus on an analysis of DTCC‚¬„¢s SDR data on interest rate derivatives activity. Our study reveals the following key rates trends this month:
- Total cleared notional amounts have risen steadily since January 2013, driving total rates notional amounts (cleared and uncleared) higher.
- Total uncleared notional amounts have risen more modestly from January 2013 through January 2014.
- SEF notional amounts have grown steadily, rising 28% since October 2013; SEF trading now represents roughly 40% of total rates notional amounts.
- Total reported notional amounts grew across FRAs, fixed-floating IRS and OIS categories; the sharpest increases were observed in OIS which increased 196% from January 2013 through January 2014.
- To date, the data do not indicate any meaningful changes to rates average daily trade size for any rates category.
Rates Summary Statistics
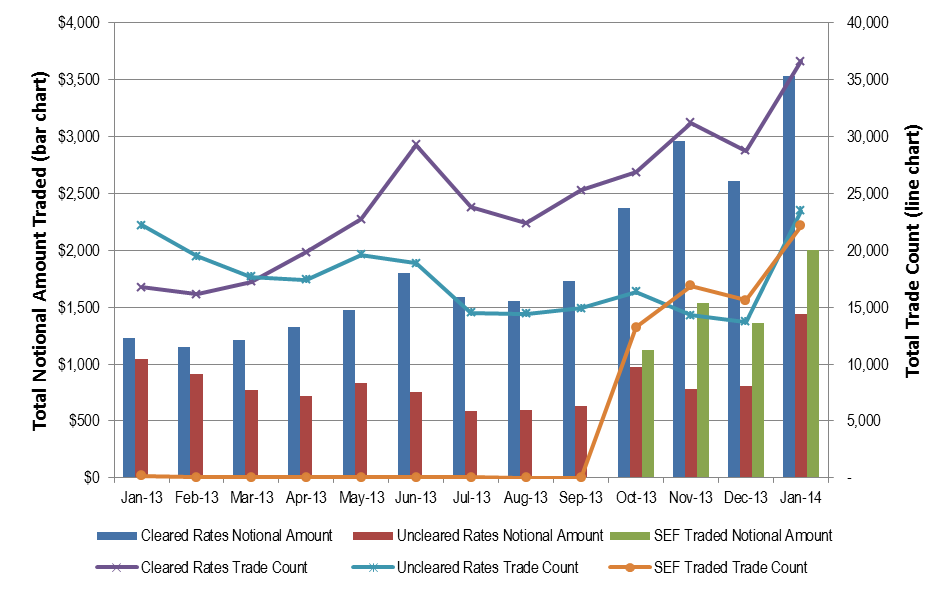
We begin this analysis by comparing aggregate rates taxonomy statistics below in Chart 1. Cleared monthly notionals have shown an increasing trend from January 2013 to January 2014, driving total rates notional amounts (cleared and uncleared) higher. Reported volumes have increased 188% since the beginning of 2013. Uncleared notionals have also shown increases throughout the year albeit to a lesser extent of 36%.
SEF traded notional amounts, which are a subset of cleared rates notional amounts, have grown steadily, increasing 28% from October 2013 through January 2014. SEF trades represented roughly 40% of total rates notional amounts in January 2014.
Cleared, uncleared and SEF traded trade counts increased throughout the period under study. Average daily trade size (not shown below) remained relatively stable, indicating that both trade counts and notionals continued to grow in tandem. This is an interesting statistic, as one might anticipate an increase in trade count accompanied by a decrease in notional amount given the introduction of SEFs.
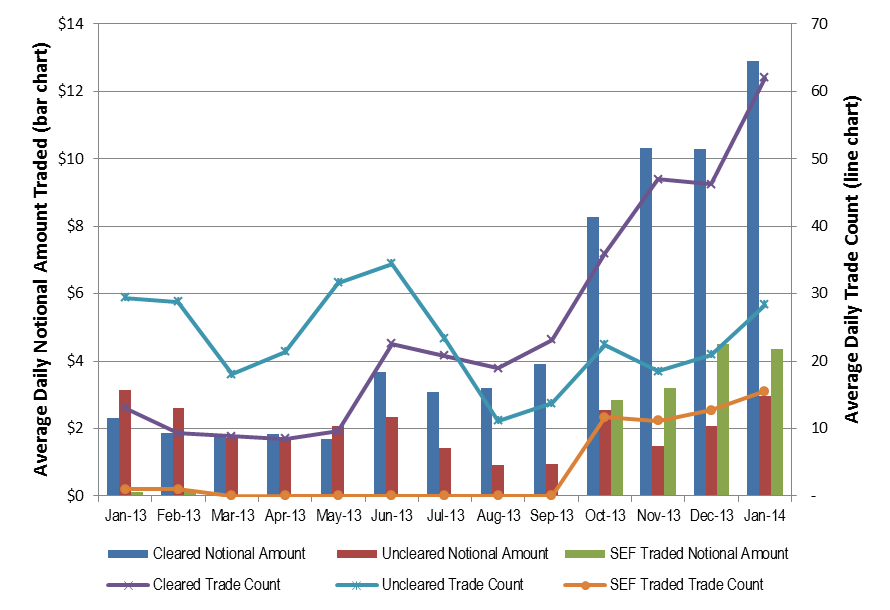
Chart 1: Rates Cleared and Uncleared Total Notional Amount Traded
And Total Trade Count by Month
FRA, Fixed-Floating and OIS Statistics
Forward Rate Agreement (FRA) total reported notional amounts climbed throughout the period, increasing 22% from January 2013 through January 2014. As highlighted in Chart 2 below, average daily cleared notionals increased 154% during the entire period under study. Uncleared daily average notional amounts were relatively steady.
SEF traded average daily notional amounts grew steadily, increasing 367% from October 2013 through January 2014. Roughly 85% of cleared FRA transactions have been traded on SEF in the month of January. Additionally, SEF trading represented 76% of total FRA volume measured in terms of notional amounts.
Cleared, uncleared and SEF average daily trade counts also increased throughout the period under study. The largest increases were observed in the cleared and SEF traded series where trade counts increased roughly twice as much as the uncleared series. To date, the data do not indicate any meaningful changes to FRA average daily trade size.
Chart 2: Forward Rate Agreement (FRA) Cleared and Uncleared
Daily Average Notional Amount Traded and Trade Count
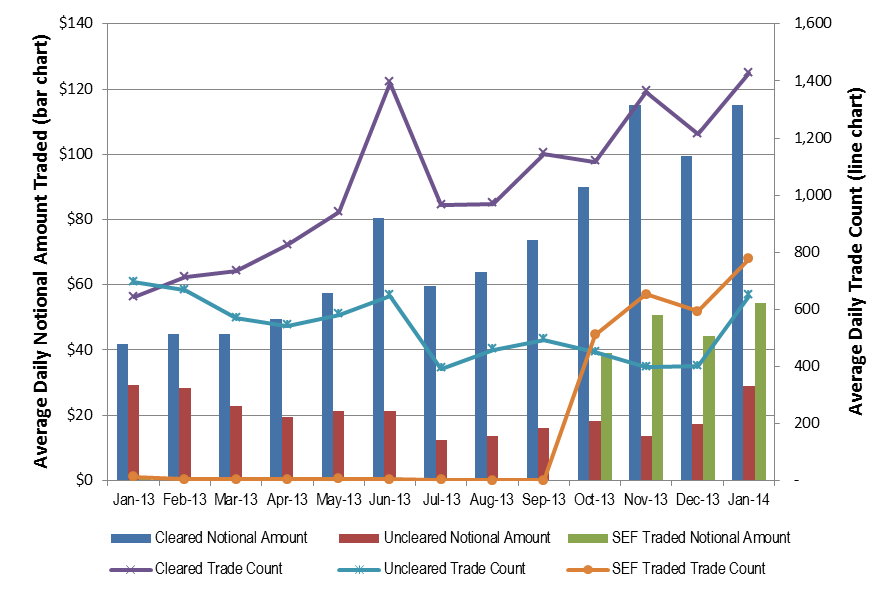
Fixed-floating IRS total reported notional amounts doubled throughout the period from January 2013 through January 2014. As highlighted in Chart 3 below, average daily cleared notionals increased 176% during the entire period under study. Uncleared daily average notional amounts were relatively steady.
SEF traded average daily notional amounts grew, increasing 40% from October 2013 through January 2014. Roughly 47% of cleared fixed-floating IRS transactions have been traded on SEF in the month of January. Additionally, SEF trading represented 38% of total fixed-floating IRS volume measured in terms of notional amounts.
Cleared, uncleared and SEF average daily trade counts also increased throughout the period under study. Cleared average daily trade counts doubled while uncleared trade counts remained steady. SEF traded average daily trade counts grew by 52% from October 2013 through January 2014. To date, the data do not indicate any meaningful changes to fixed-floating IRS average daily trade size.
Chart 3: Fixed Floating IRS Cleared and Uncleared
Daily Average Notional Amount Traded and Trade Count
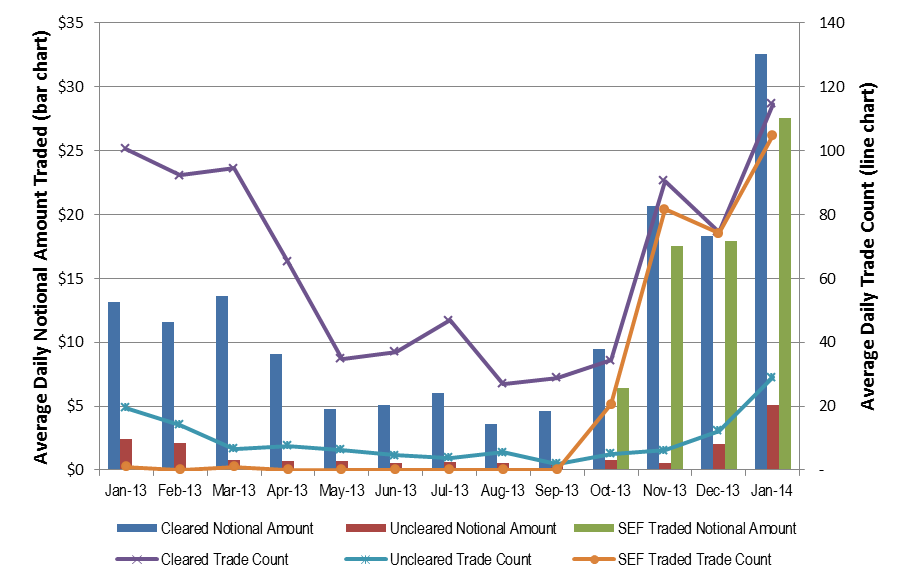
Overnight Index Swap (OIS) total reported notional amounts increased 196% from January 2013 through January 2014. As highlighted in Chart 4 below, this change was driven by both cleared and uncleared OIS. Average daily cleared notionals increased 56% during the entire period under study. Uncleared daily average notional amounts increased 16%.
SEF traded average daily notional amounts grew, increasing 53% from October 2013 through January 2014. Roughly 33% of cleared OIS transactions have been traded on SEF in the month of January. Additionally, SEF trading represented 27% of total OIS volume measured in terms of notional amounts.
Cleared, uncleared and SEF average daily trade counts also increased throughout the period under study. Cleared average daily trade counts doubled while uncleared trade counts remained steady. SEF traded average daily trade counts grew by 52% from October 2013 through January 2014. To date, the data do not indicate any meaningful changes to fixed-floating IRS average daily trade size.
Chart 4: OIS Cleared and Uncleared
Daily Average Notional Amount Traded and Trade Count