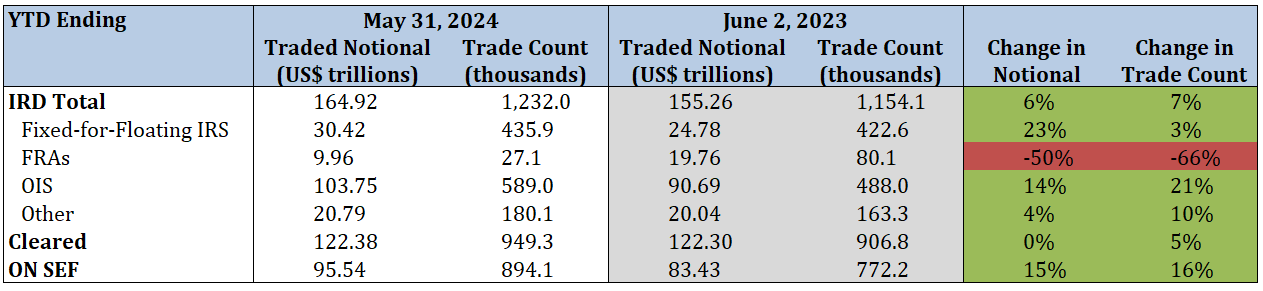
Interest Rate Derivatives
- Total IRD traded notional and trade count increased by 6% and 7%, respectively
- Fixed-for-floating IRS traded notional and trade count increased by 23% and 3%, respectively
- FRA traded notional and trade count decreased by 50% and 66%, respectively
- OIS traded notional and trade count increased by 14% and 21%, respectively
- 74% of total traded notional was cleared vs. 79% last year
- 58% of total traded notional was executed on SEFs vs. 54% last year
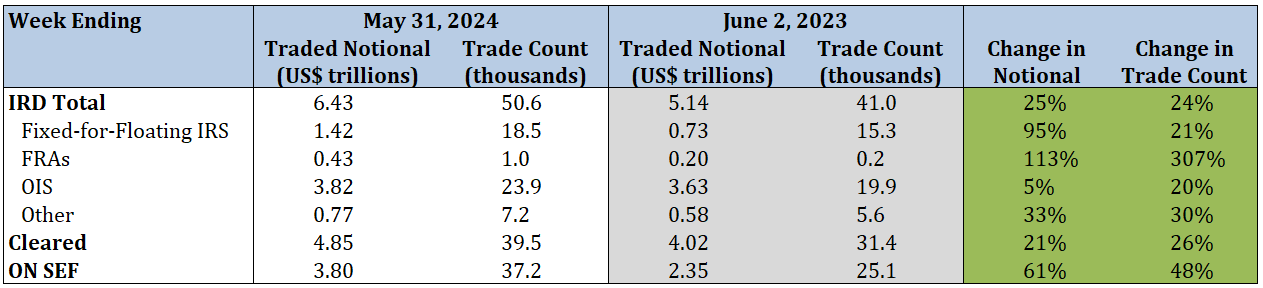
2024 Current Week vs. 2023 Current Week
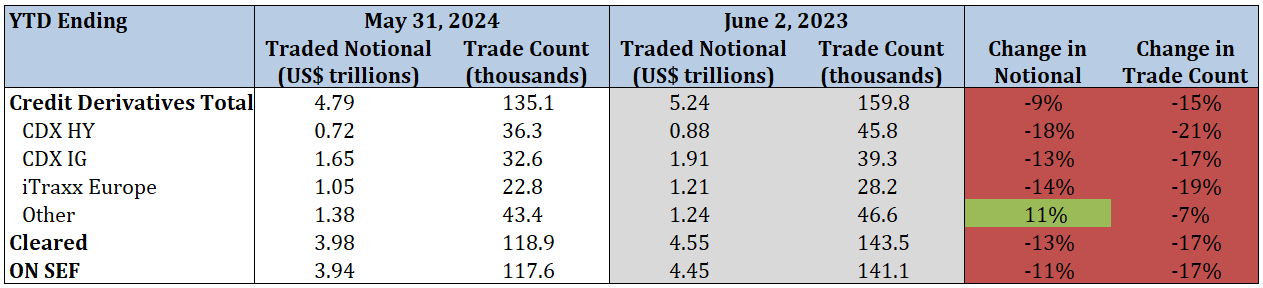
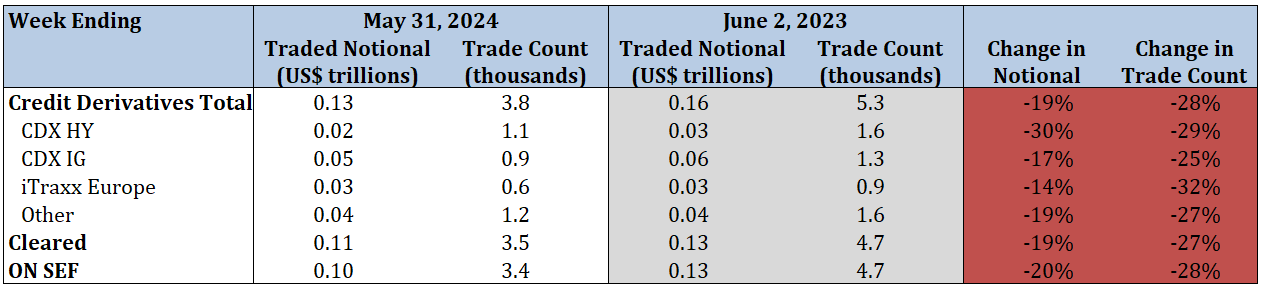
Credit Derivatives Reported under CFTC Regulations
2024 YTD vs. 2023 YTD
- Total index credit derivatives traded notional and trade count decreased by 9% and 15%, respectively
- CDX HY traded notional and trade count decreased by 18% and 21%, respectively
- CDX IG traded notional and trade count decreased by 13% and 17%, respectively
- iTraxx Europe traded notional and trade count decreased by 14% and 19%, respectively
- 83% of total traded notional was cleared vs. 87% last year
- 82% of total traded notional was executed on SEFs vs. 85% last year
2024 Current Week vs. 2023 Current Week
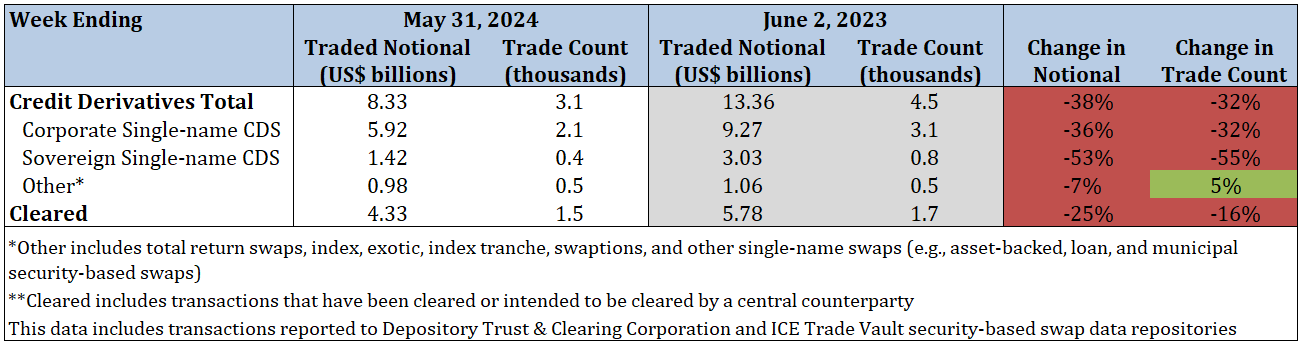
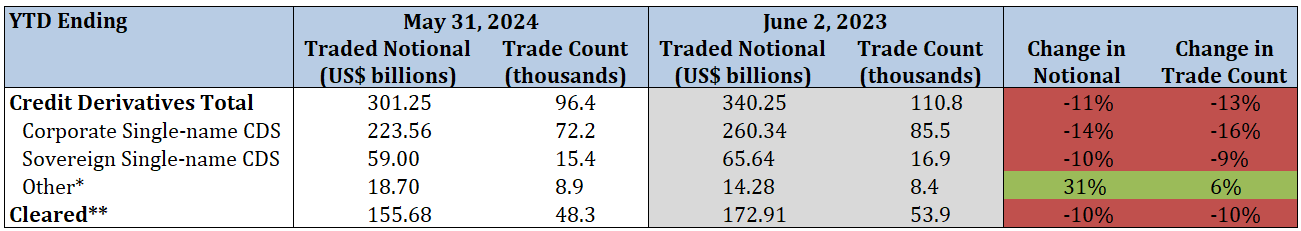
Credit Derivatives Reported under SEC Regulations
2024 YTD vs. 2023 YTD
- Total security-based credit derivatives traded notional and trade count decreased by 11% and 13%, respectively
- Corporate single-name CDS traded notional and trade count decreased by 14% and 16%, respectively
- Sovereign single-name CDS traded notional and trade count decreased by 10% and 9%, respectively
- 52% of total traded notional was cleared vs. 51% last year
2024 Current Week vs. 2023 Current Week