Check out the latest research paper SwapsInfo First Half of 2024 and the Second Quarter of 2024 Review.
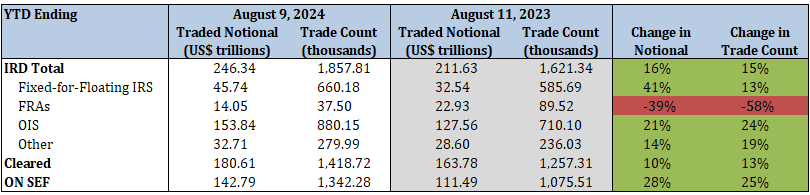
Interest Rate Derivatives
- Total IRD traded notional and trade count increased by 16% and 15%, respectively
- Fixed-for-floating IRS traded notional and trade count increased by 41% and 13%, respectively
- FRA traded notional and trade count decreased by 39% and 58%, respectively
- OIS traded notional and trade count increased by 21% and 24%, respectively
- 73% of total traded notional was cleared vs. 77% last year
- 58% of total traded notional was executed on SEFs vs. 53% last year
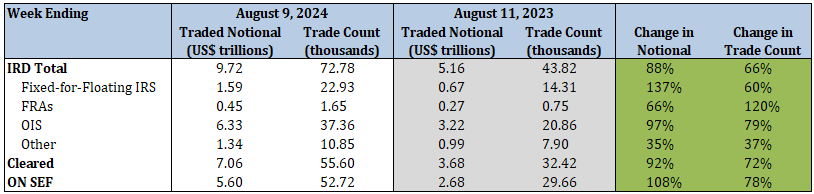
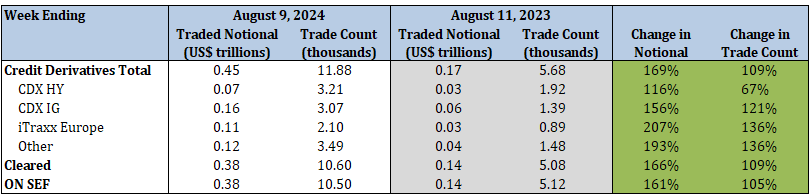
2024 Current Week vs. 2023 Current Week
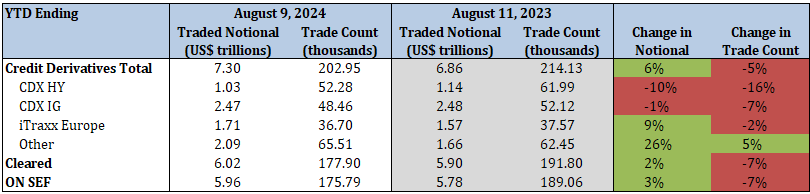
Credit Derivatives Reported under CFTC Regulations
2024 YTD vs. 2023 YTD
- Total index credit derivatives traded notional increased by 6%, while trade count decreased by 5%
- CDX HY traded notional and trade count decreased by 10% and 16%, respectively
- CDX IG traded notional and trade count decreased by 1% and 7%, respectively
- iTraxx Europe traded notional increased by 9%, while trade count decreased by 2%
- 82% of total traded notional was cleared vs. 86% last year
- 82% of total traded notional was executed on SEFs vs. 84% last year
2024 Current Week vs. 2023 Current Week
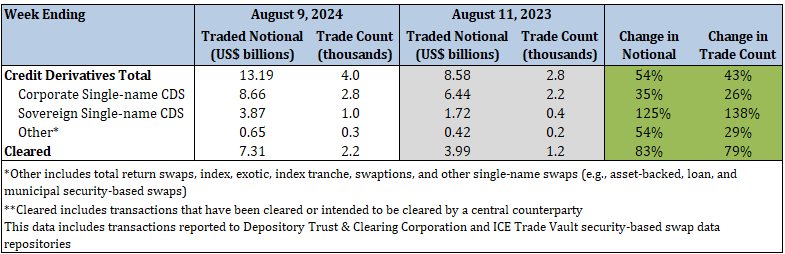
Credit Derivatives Reported under SEC Regulations
2024 YTD vs. 2023 YTD
- Total security-based credit derivatives traded notional and trade count decreased by 13% and 15%, respectively
- Corporate single-name CDS traded notional and trade count decreased by 17% and 19%, respectively
- Sovereign single-name CDS traded notional and trade count both decreased by 6%
- 52% of total traded notional was cleared vs. 50% last year
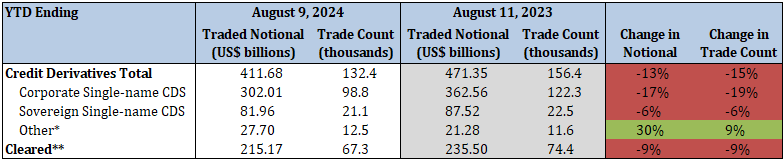
2024 Current Week vs. 2023 Current Week