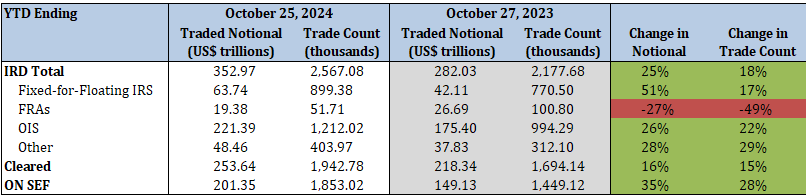
Interest Rate Derivatives
- Total IRD traded notional and trade count increased by 25% and 18%, respectively
- Fixed-for-floating IRS traded notional and trade count increased by 51% and 17%, respectively
- FRA traded notional and trade count decreased by 27% and 49%, respectively
- OIS traded notional and trade count increased by 26% and 22%, respectively
- 72% of total traded notional was cleared vs. 77% last year
- 57% of total traded notional was executed on SEFs vs. 53% last year
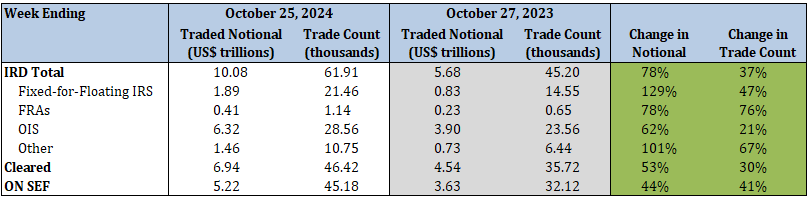
2024 Current Week vs. 2023 Current Week
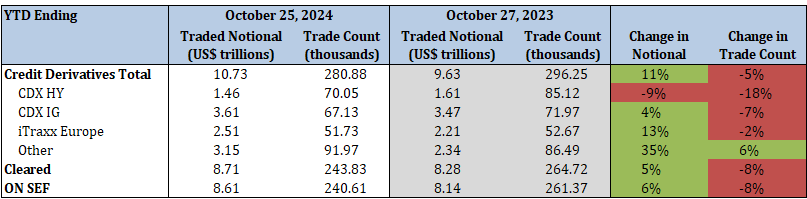
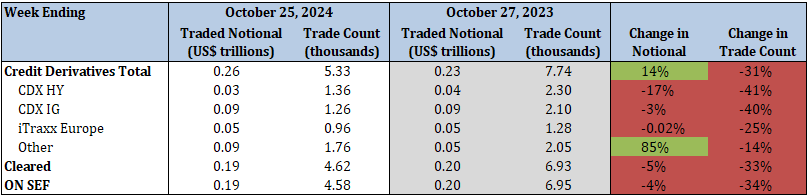
Credit Derivatives Reported under CFTC Regulations
2024 YTD vs. 2023 YTD
- Total index credit derivatives traded notional increased by 11%, while trade count decreased by 5%
- CDX HY traded notional and trade count decreased by 9% and 18%, respectively
- CDX IG traded notional increased by 4%, while trade count decreased by 7%
- iTraxx Europe traded notional increased by 13%, while trade count decreased by 2%
- 81% of total traded notional was cleared vs. 86% last year
- 80% of total traded notional was executed on SEFs vs. 85% last year
2024 Current Week vs. 2023 Current Week
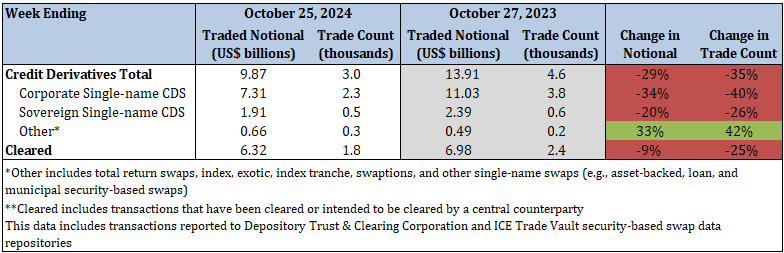
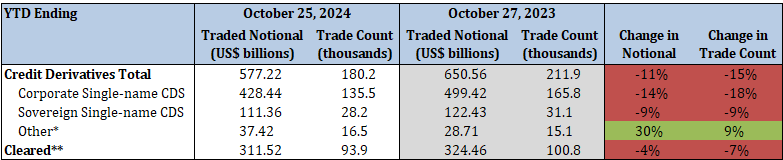
Credit Derivatives Reported under SEC Regulations
2024 YTD vs. 2023 YTD
- Total security-based credit derivatives traded notional and trade count decreased by 11% and 15%, respectively
- Corporate single-name CDS traded notional and trade count decreased by 14% and 18%, respectively
- Sovereign single-name CDS traded notional and trade count both decreased by 9%
- 54% of total traded notional was cleared vs. 50% last year
2024 Current Week vs. 2023 Current Week