A planned system upgrade by the DTCC SDR on November 21st, 2020 changed reporting logic for the cleared status of trades. Following the upgrade, the percentage of IRD trades indicated to be cleared appeared lower than historical averages as firms switched to the new reporting logic.
ISDA-Clarus RFR Adoption Indicator decreased to 8.8% in March compared to 10.6% the prior month. The indicator tracks how much global trading activity (as measured by DV01) is conducted in cleared over-the-counter and exchange-traded interest rate derivatives (IRD) that reference the identified risk-free rates (RFRs) in six major currencies. The latest March report is available here.
Interest Rate Derivatives
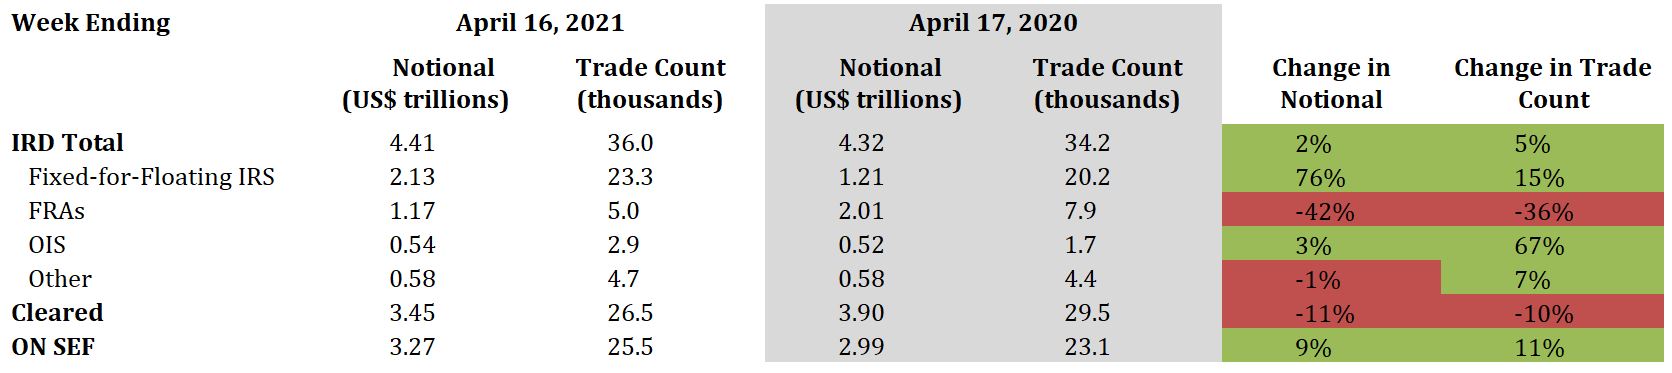
2021 Current Week vs. 2020 Current Week
- Total IRD traded notional and trade count increased by 2% and 5%, respectively
- Fixed-for-floating IRS traded notional and trade count increased by 76% and 15%, respectively
- FRAs traded notional and trade count decreased by 42% and 36%, respectively
- OIS traded notional and trade count increased by 3% and 67%, respectively
- 78% of total traded notional was cleared vs. 90% last year
- 74% of total traded notional was executed On SEF vs. 69% last year
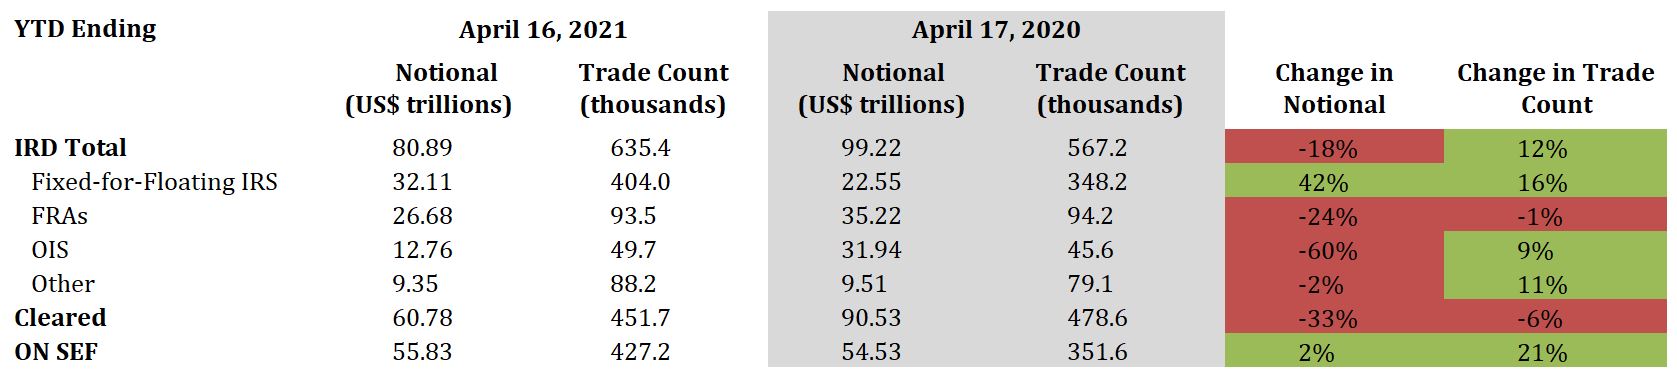
2021 YTD vs. 2020 YTD
- Total IRD traded notional decreased by 18%, while trade count increased by 12%
- Fixed-for-floating IRS traded notional and trade count increased by 42% and 16%, respectively
- FRAs traded notional and trade count decreased by 24% and 1%, respectively
- OIS traded notional decreased by 60%, while trade count increased by 9%
- 75% of total traded notional was cleared vs. 91% last year
- 69% of total traded notional was executed On SEF vs. 55% last year
Interest Rate Derivatives: Benchmark Data
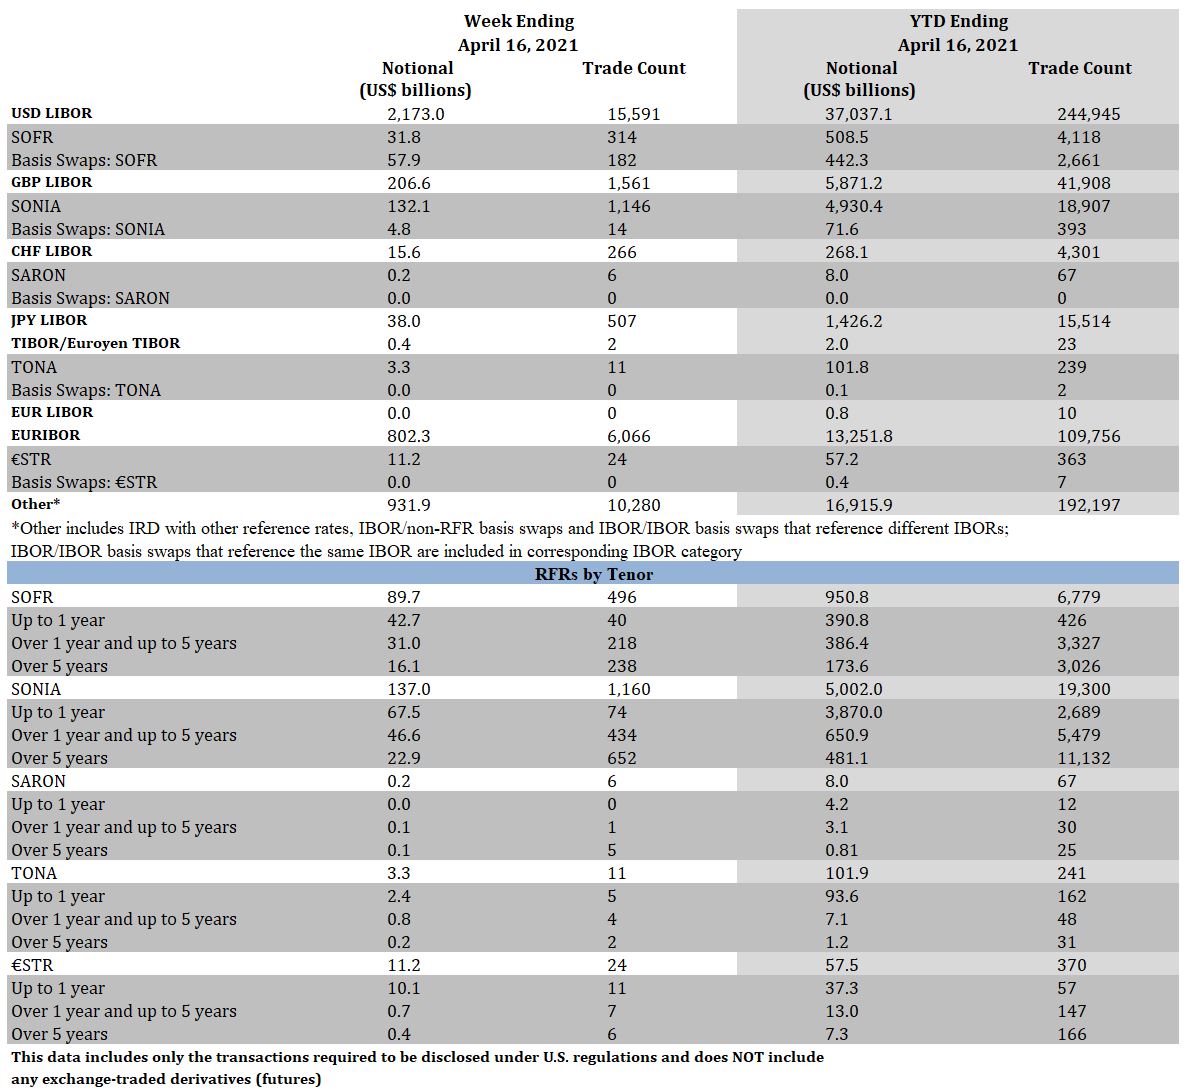
Week Ending April 16, 2021
- SOFR traded notional totaled $89.7 billion, including $57.9 billion of basis swaps. Trade count totaled 496, including 182 basis swaps
- SONIA traded notional totaled $137.0 billion, including $4.8 billion of basis swaps. Trade count totaled 1,160, including 14 basis swaps
- SARON traded notional and trade count was $0.2 billion and 6, respectively
- TONA traded notional and trade count was $3.3 billion and 11, respectively
- €STR traded notional and trade count was $11.2 billion and 24, respectively
YTD Ending April 16, 2021
- SOFR traded notional totaled $950.8 billion, including $442.3 billion of basis swaps. Trade count totaled 6,779, including 2,661 basis swaps
- SONIA traded notional totaled $5.0 trillion, including $71.6 billion of basis swaps. Trade count totaled 19,300, including 393 basis swaps
- SARON traded notional and trade count was $8.0 billion and 67, respectively
- TONA traded notional totaled $101.9 billion, including $0.1 billion of basis swaps. Trade count totaled 241, including 2 basis swaps
- €STR traded notional totaled $57.5 billion, including $0.4 billion of basis swaps. Trade count totaled 370, including 7 basis swaps
Click Here to View Historical Benchmark Data
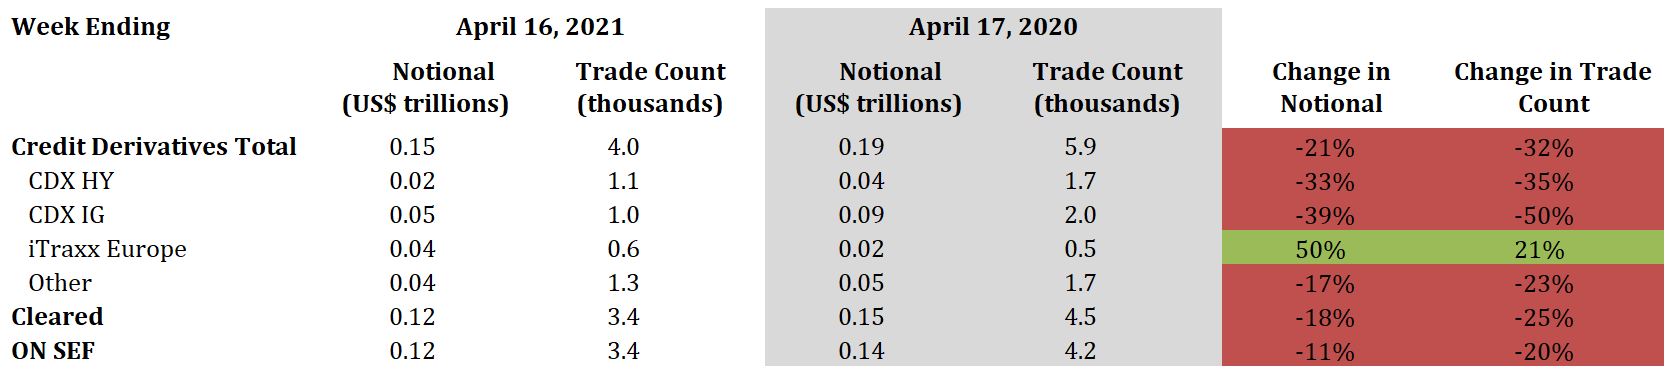
Credit Derivatives
2021 Current Week vs. 2020 Current Week
- Total credit derivatives traded notional and trade count decreased by 21% and 32%, respectively
- CDX HY traded notional and trade count decreased by 33% and 35%, respectively
- CDX IG traded notional and trade count decreased by 39% and 50%, respectively
- iTraxx Europe traded notional and trade count increased by 50% and 21%, respectively
- 81% of total traded notional was cleared vs. 78% last year
- 81% of total traded notional was executed On SEF vs. 72% last year
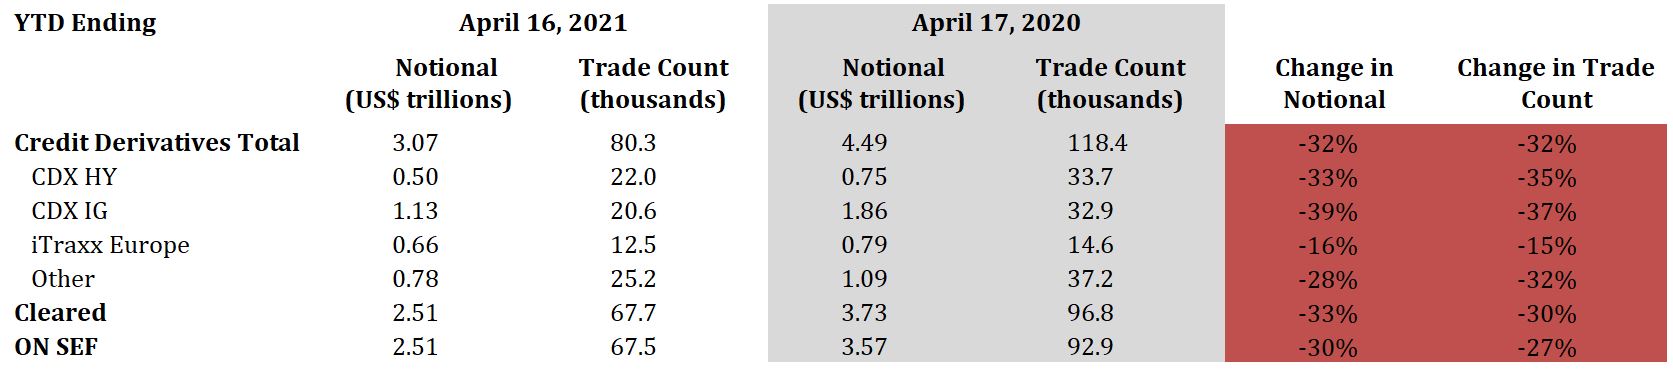
2021 YTD vs. 2020 YTD
- Total credit derivatives traded notional and trade count both decreased by 32%
- CDX HY traded notional and trade count decreased by 33% and 35%, respectively
- CDX IG traded notional and trade count decreased by 39% and 37%, respectively
- iTraxx Europe traded notional and trade count decreased by 16% and 15%, respectively
- 82% of total traded notional was cleared vs. 83% last year
- 82% of total traded notional was executed On SEF vs. 79% last year