The weekly trading data for credit derivatives is temporary unavailable due to the changes in data reporting fields as the result of the CFTC Rewrite Phase 2, which went live on January 27th, 2024. ISDA Research team is in the process of integrating these changes into the SwapsInfo database and will continue to publish the weekly reports as soon as this integration is complete.
Interest Rate Derivatives
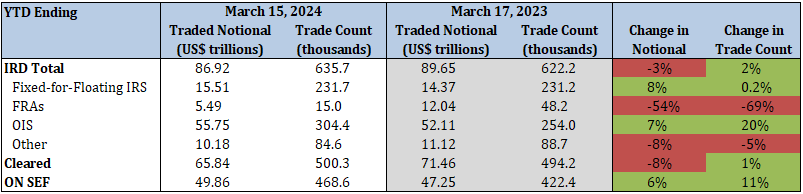
2024 YTD vs. 2023 YTD
- Total IRD traded notional decreased by 3%, while trade count increased by 2%
- Fixed-for-floating IRS traded notional and trade count increased by 8% and 0.2%, respectively
- FRA traded notional and trade count decreased by 54% and 69%, respectively
- OIS traded notional and trade count increased by 7% and 20%, respectively
- 76% of total traded notional was cleared vs. 80% last year
- 57% of total traded notional was executed on SEFs vs. 53% last year
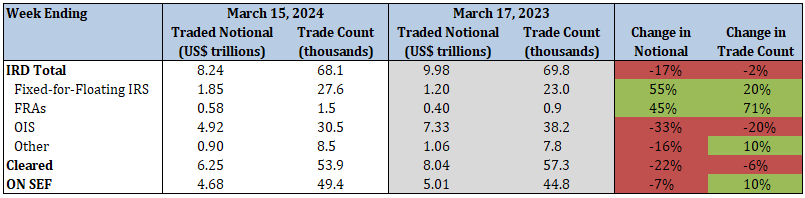
2024 Current Week vs. 2023 Current Week