Check out the latest research papers ISDA-Clarus RFR Adoption Indicator: May 2023 and Key Trends in the Size and Composition of OTC Derivatives Markets in the Second Half of 2022.
Interest Rate Derivatives
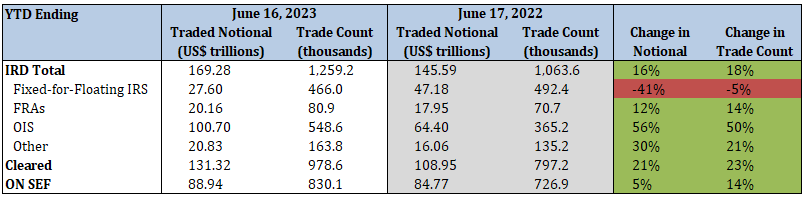
2023 YTD vs. 2022 YTD
- Total IRD traded notional and trade count increased by 16% and 18%, respectively
- Fixed-for-floating IRS traded notional and trade count decreased by 41% and 5%, respectively
- FRA traded notional and trade count increased by 12% and 14%, respectively
- OIS traded notional and trade count increased by 56% and 50%, respectively
- 78% of total traded notional was cleared vs. 75% last year
- 53% of total traded notional was executed on SEFs vs. 58% last year
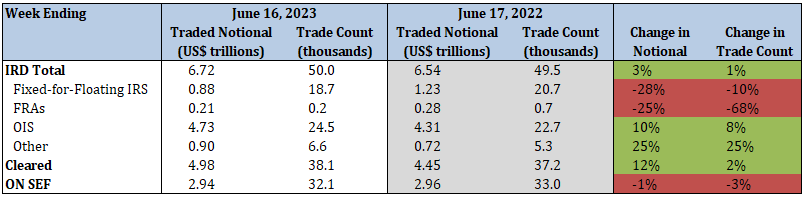
2023 Current Week vs. 2022 Current Week
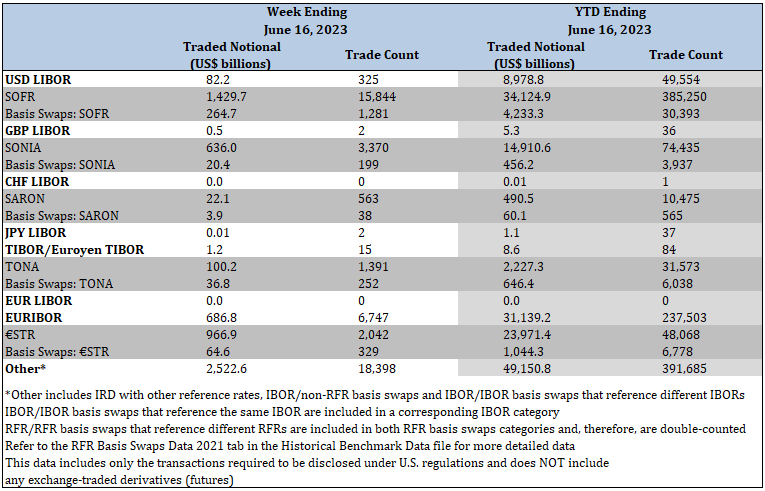
Interest Rate Derivatives: Benchmark Data
YTD Ending June 16, 2023
- SOFR traded notional totaled $38.4 trillion, including $4.2 trillion of basis swaps. Trade count totaled 415.6 thousand, including 30.4 thousand basis swaps
- SONIA traded notional totaled $15.4 trillion, including $456.2 billion of basis swaps. Trade count totaled 78.4 thousand, including 3.9 thousand basis swaps
- SARON traded notional totaled $550.6 billion, including $60.1 billion of basis swaps. Trade count totaled 11.0 thousand, including 565 basis swaps
- TONA traded notional totaled $2.9 trillion, including $646.4 billion of basis swaps. Trade count totaled 37.6 thousand, including 6.0 thousand basis swaps
- €STR traded notional totaled $25.0 trillion, including $1.0 trillion of basis swaps. Trade count totaled 54.9 thousand, including 6.8 thousand basis swaps
Click here to view RFR data by product and tenor and RFR historical data
Credit Derivatives Reported under CFTC Regulations
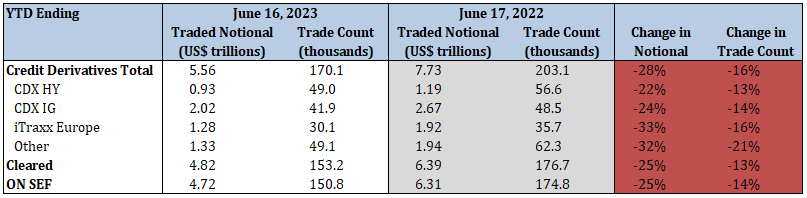
2023 YTD vs. 2022 YTD
- Total index credit derivatives traded notional and trade count decreased by 28% and 16%, respectively
- CDX HY traded notional and trade count decreased by 22% and 13%, respectively
- CDX IG traded notional and trade count decreased by 24% and 14%, respectively
- iTraxx Europe traded notional and trade count decreased by 33% and 16%, respectively
- 87% of total traded notional was cleared vs. 83% last year
- 85% of total traded notional was executed on SEFs vs. 82% last year
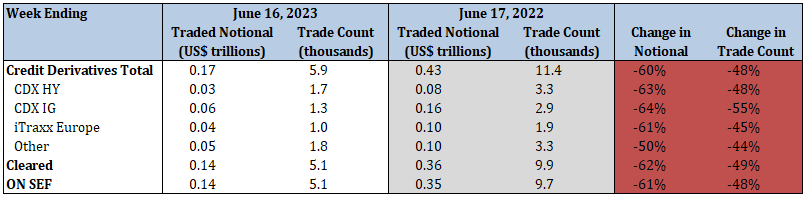
2023 Current Week vs. 2022 Current Week
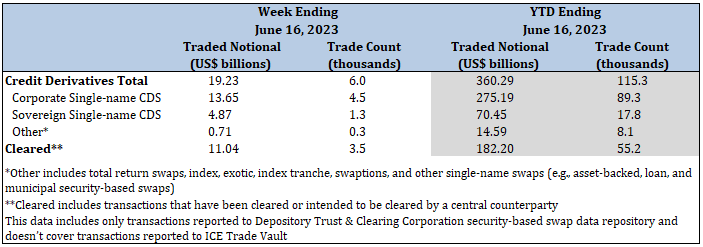
Credit Derivatives Reported under SEC Regulations
YTD Ending June 16, 2023
- Total security-based credit derivatives traded notional totaled $360.3 billion, while trade count totaled 115.3 thousand
- Corporate single-name CDS traded notional totaled $275.2 billion, and trade count was 89.3 thousand
- Sovereign single-name CDS traded notional totaled $70.5 billion, and trade count was 17.8 thousand
- 51% of total traded notional was cleared