Interest Rate Derivatives
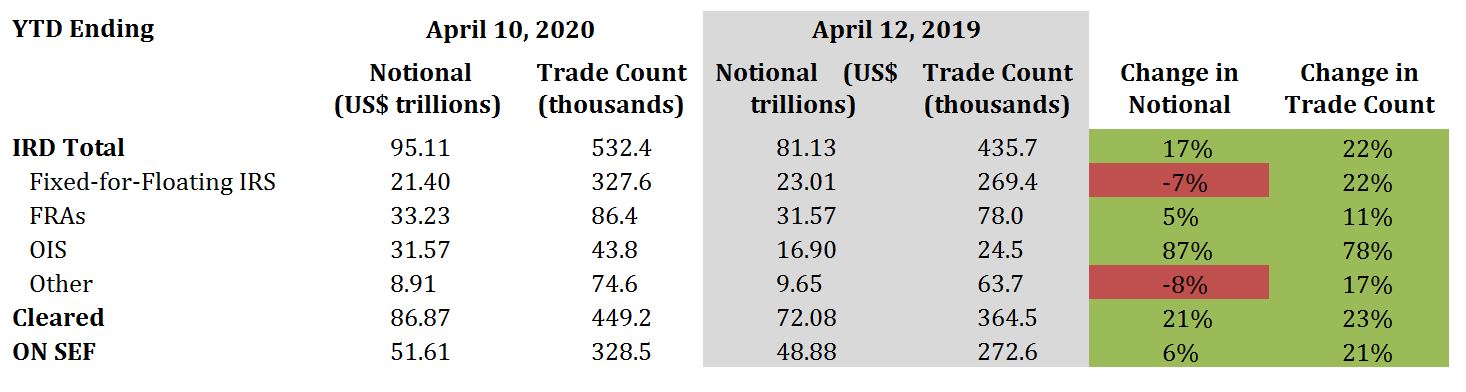
2020 YTD vs. 2019 YTD
- Total IRD traded notional and trade count increased by 17% and 22%, respectively
- Fixed-for-floating IRS traded notional decreased by 7%, while trade count increased by 22%
- FRAs traded notional and trade count increased by 5% and 11%, respectively
- OIS traded notional and trade count increased by 87% and 78%, respectively
- 91% of total traded notional was cleared vs. 89% last year
- 54% of total traded notional was executed On SEF vs. 60% last year
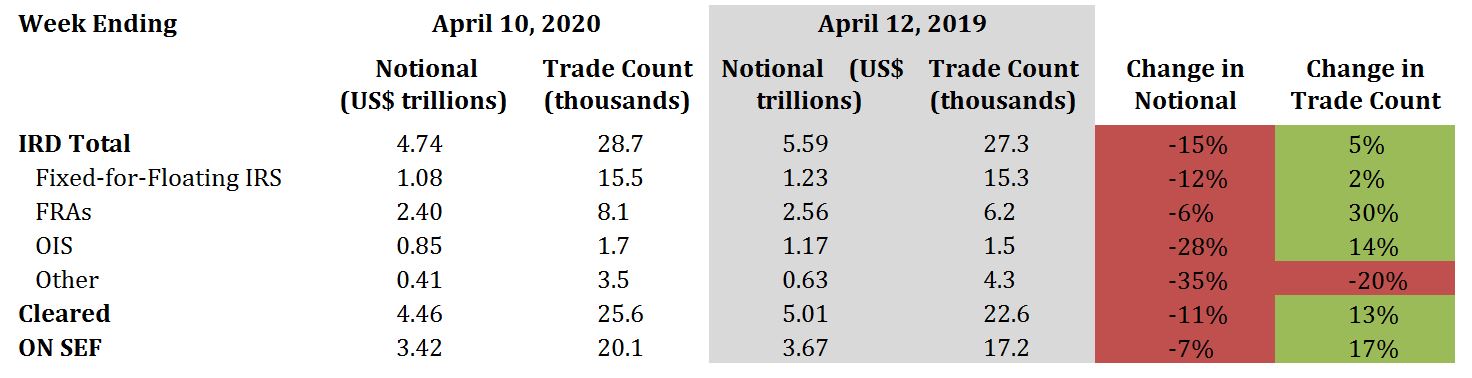
2020 Current Week vs. 2019 Current Week
- Total IRD traded notional decreased by 15%, while trade count increased by 5%
- Fixed-for-floating IRS traded notional decreased by 12%, while trade count increased by 2%
- FRAs traded notional decreased by 6%, while trade count increased by 30%
- OIS traded notional decreased by 28%, while trade count increased by 14%
- 94% of total traded notional was cleared vs. 90% last year
- 72% of total traded notional executed On SEF vs. 66% last year
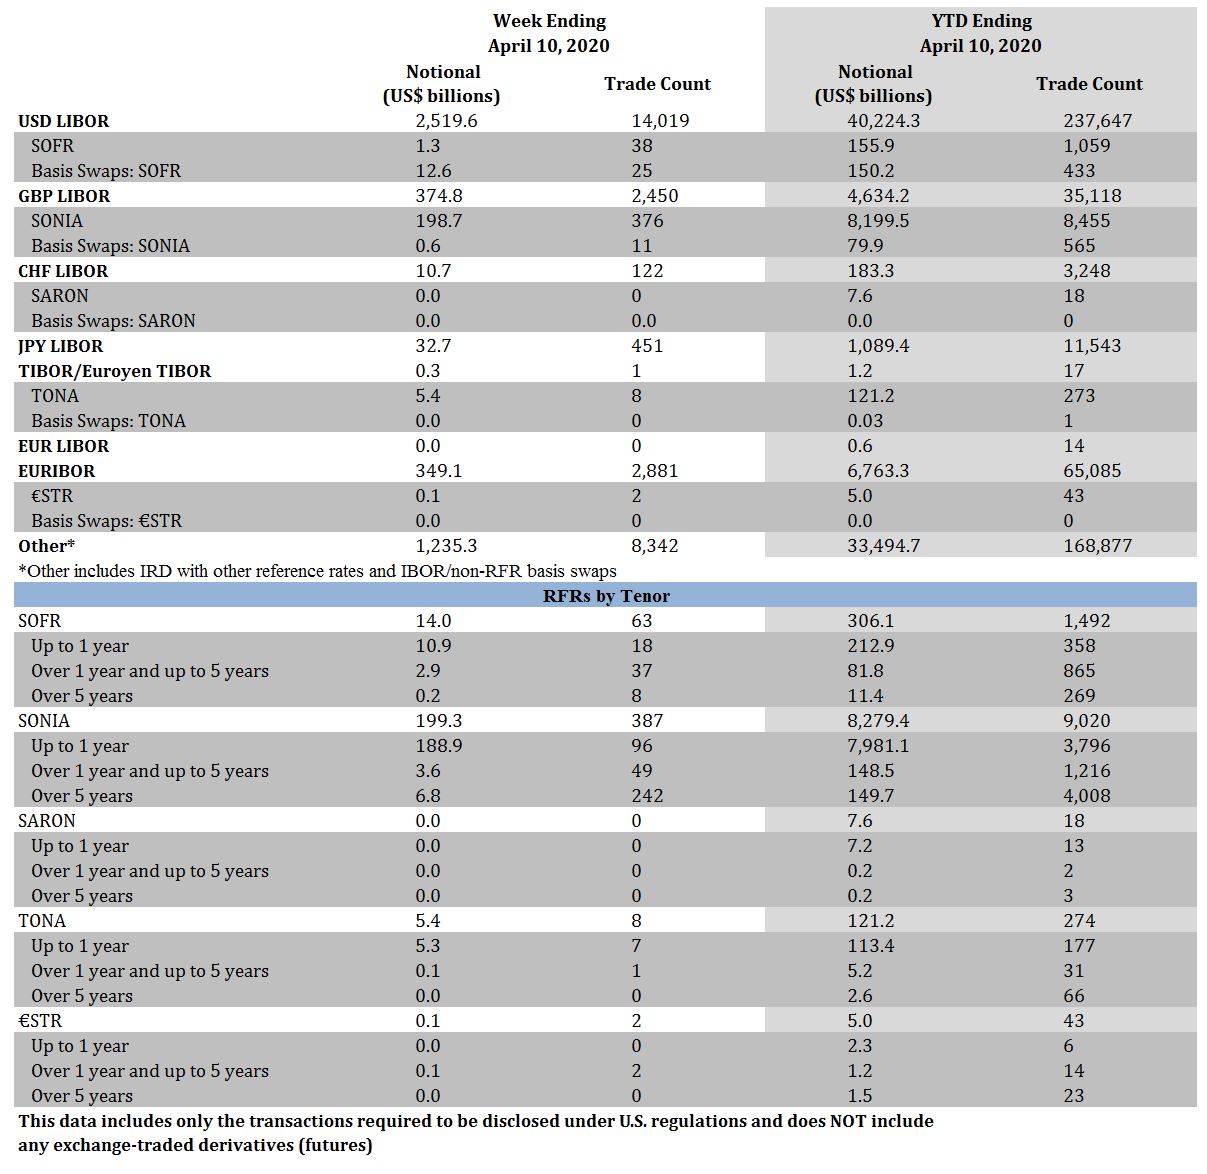
Interest Rate Derivatives: Benchmark Data
Week Ending April 10, 2020
- SOFR traded notional totaled $14.0 billion, including $12.6 billion of basis swaps. Trade count totaled 63, including 25 basis swaps
- SONIA traded notional totaled $199.3 billion, including $0.6 billion of basis swaps. Trade count totaled 387, including 11 basis swaps
- There were no SARON trades
- TONA traded notional and trade count was $5.4 billion and 8, respectively
- €STR traded notional and trade count was $0.1 billion and 2, respectively
YTD Ending April 10, 2020
- SOFR traded notional totaled $306.1 billion, including $150.2 billion of basis swaps. Trade count totaled 1,492, including 433 basis swaps
- SONIA traded notional totaled $8.3 trillion, including $79.9 billion of basis swaps. Trade count totaled 9,020, including 565 basis swaps
- SARON traded notional and trade count was $7.6 billion and 18, respectively
- TONA traded notional totaled $121.2 billion, including $30 million of basis swaps. Trade count totaled 274, including 1 basis swap
- €STR traded notional and trade count was $5.0 billion and 43, respectively
Click Here to View Historical Benchmark Data
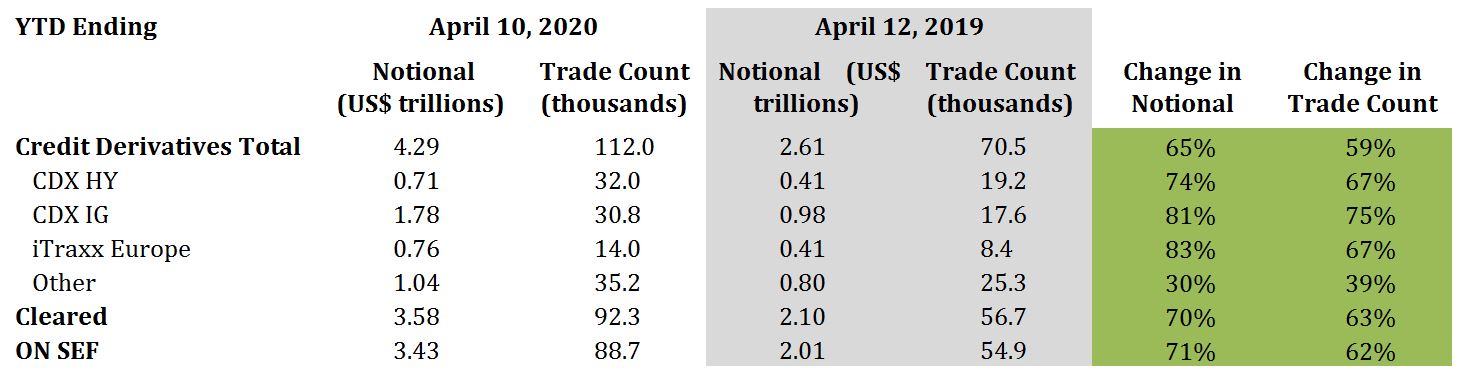
Credit Derivatives
2020 YTD vs. 2019 YTD
- Total credit derivatives traded notional and trade count increased by 65% and 59%, respectively
- CDX HY traded notional and trade count increased by 74% and 67%, respectively
- CDX IG traded notional and trade count increased by 81% and 75%, respectively
- iTraxx Europe traded notional and trade count increased by 83% and 67%, respectively
- 83% of total traded notional was cleared vs. 81% last year
- 80% of total traded notional was executed On SEF vs.77% last year
2020 Current Week vs. 2019 Current Week
- Total credit derivatives traded notional and trade count increased by 82% and 70%, respectively
- CDX HY traded notional and trade count increased by 155% and 111%, respectively
- CDX IG traded notional and trade count both increased by 89%
- iTraxx Europe traded notional and trade count increased by 76% and 77%, respectively
- 83% of total traded notional was cleared vs. 77% last year
- 80% of total traded notional executed On SEF vs. 73% last year