Interest Rate Derivatives
2019 YTD vs. 2018 YTD
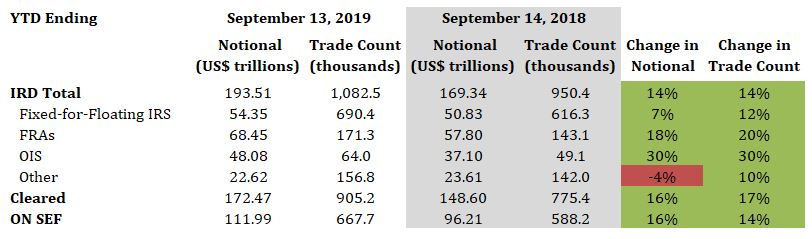
- Total IRD traded notional and trade count both increased by 14%
- Fixed-for-floating IRS traded notional and trade count increased by 7% and 12%, respectively
- FRAs traded notional and trade count increased by 18% and 20%, respectively
- OIS traded notional and trade count both increased by 30%
- 89% of total traded notional was cleared vs. 88% last year
- 58% of total traded notional was executed On SEF vs. 57% last year
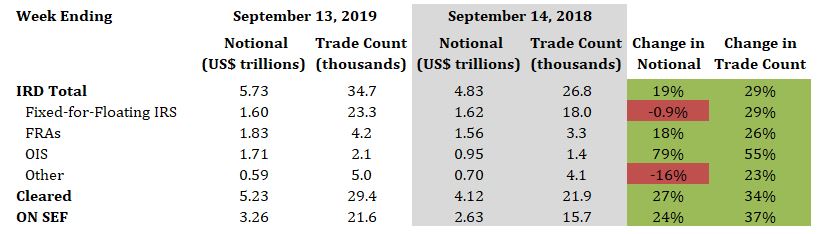
2019 Current Week vs. 2018 Current Week
- Total IRD traded notional and trade count increased by 19% and 29%, respectively
- Fixed-for-floating IRS traded notional decreased by 0.9%, while trade count increased by 29%
- FRAs traded notional and trade count increased by 18% and 26%, respectively
- OIS traded notional and trade count increased by 79% and 55%, respectively
- 91% of total traded notional was cleared vs. 85% last year
- 57% of total traded notional was executed On SEF vs. 54% last year
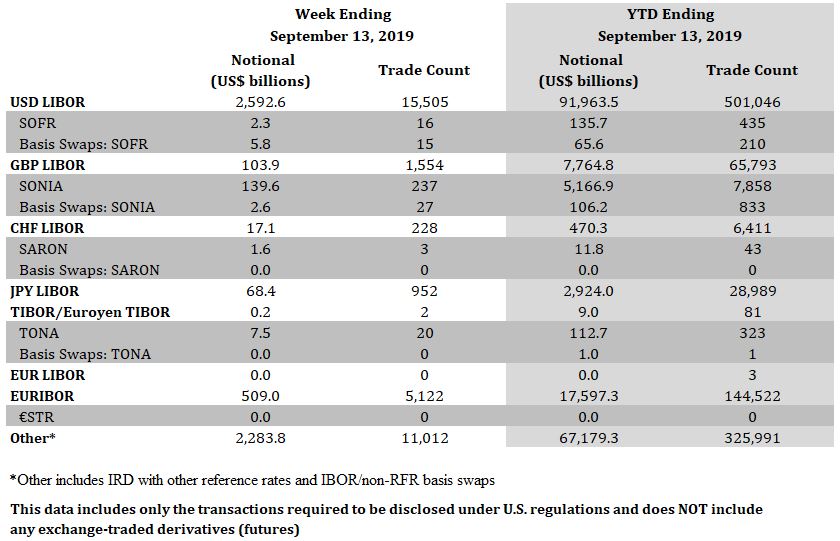
Interest Rate Derivatives: Benchmark Data
Week Ending September 13, 2019
- SOFR traded notional totaled $8.1 billion, including $5.8 billion of basis swaps. Trade count totaled 31, including 15 basis swaps
- SONIA traded notional totaled $142.2 billion, including $2.6 billion of basis swaps. Trade count totaled 264, including 27 basis swaps
- SARON traded notional and trade count was $1.6 billion and 3, respectively
- TONA traded notional and trade count was $7.5 billion and 20, respectively
YTD Ending September 13, 2019
- SOFR traded notional totaled $201.3 billion, including $65.6 billion of basis swaps. Trade count totaled 645, including 210 basis swaps
- SONIA traded notional totaled $5.3 trillion, including $106.2 billion of basis swaps. Trade count totaled 8,691, including 833 basis swaps
- SARON traded notional and trade count was $11.8 billion and 43, respectively
- TONA traded notional totaled $113.7 billion, including $1.0 billion of basis swaps. Trade count totaled 324, including 1 basis swap
Click Here to View Historical Benchmark Data
Credit Derivatives
2019 YTD vs. 2018 YTD
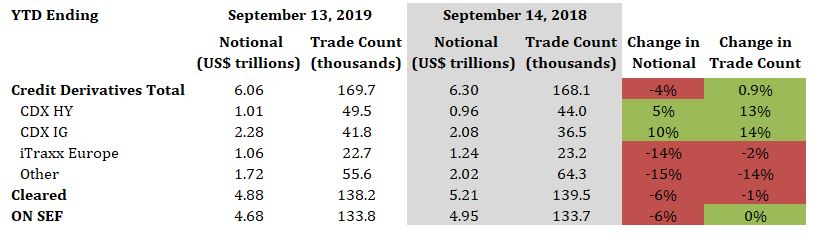
- Total credit derivatives traded notional decreased by 4%, while trade count increased by 0.9%
- CDX HY traded notional and trade count increased by 5% and 13%, respectively
- CDX IG traded notional and trade count increased by 10% and 14%, respectively
- iTraxx Europe traded notional and trade count decreased by 14% and 2%, respectively
- 80% of total traded notional was cleared vs. 83% last year
- 77% of total traded notional was executed On SEF vs. 79% last year
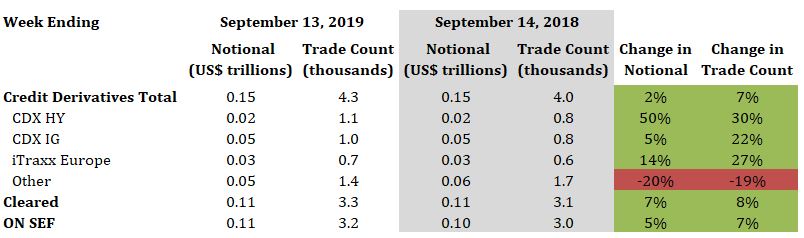
2019 Current Week vs. 2018 Current Week
- Total credit derivatives traded notional and trade count increased by 2% and 7%, respectively
- CDX HY traded notional and trade count increased by 50% and 30%, respectively
- CDX IG traded notional and trade count increased by 5% and 22%, respectively
- iTraxx Europe traded notional and trade count increased by 14% and 27%, respectively
- 76% of total traded notional was cleared vs. 73% last year
- 72% of total traded notional was executed On SEF vs. 70% last year