ISDA has expanded its SwapsInfo website to include interest rate derivatives trading activity reported in the EU and UK. The new data is based on transactions publicly reported by 30 European approved publication arrangements and trading venues.
Check out the latest ISDA-Clarus RFR Adoption Indicator: April 2022.
Interest Rate Derivatives
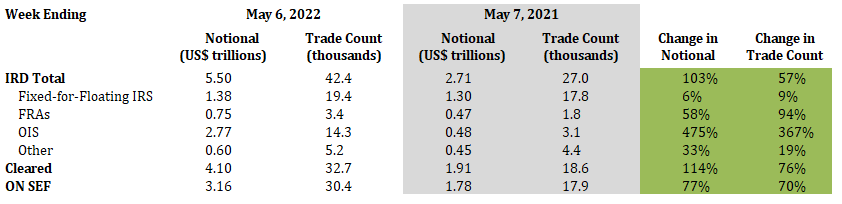
2022 Current Week vs. 2021 Current Week
- Total IRD traded notional and trade count increased by 103% and 57%, respectively
- Fixed-for-floating IRS traded notional and trade count increased by 6% and 9%, respectively
- FRA traded notional and trade count increased by 58% and 94%, respectively
- OIS traded notional and trade count increased by 475% and 367%, respectively
- 74% of total traded notional was cleared vs. 71% last year
- 57% of total traded notional was executed on SEFs vs. 66% last year
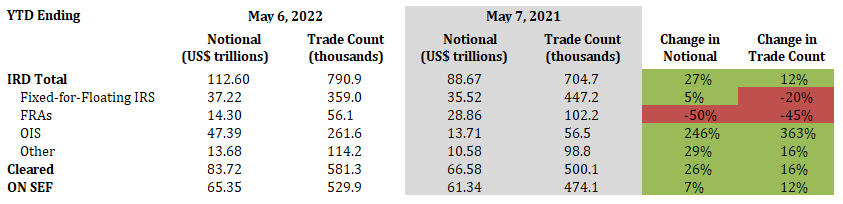
2022 YTD vs. 2021 YTD
- Total IRD traded notional and trade count increased by 27% and 12%, respectively
- Fixed-for-floating IRS traded notional increased by 5%, while trade count decreased by 20%
- FRA traded notional and trade count decreased by 50% and 45%, respectively
- OIS traded notional and trade count increased by 246% and 363%, respectively
- 74% of total traded notional was cleared vs. 75% last year
- 58% of total traded notional was executed on SEFs vs. 69% last year
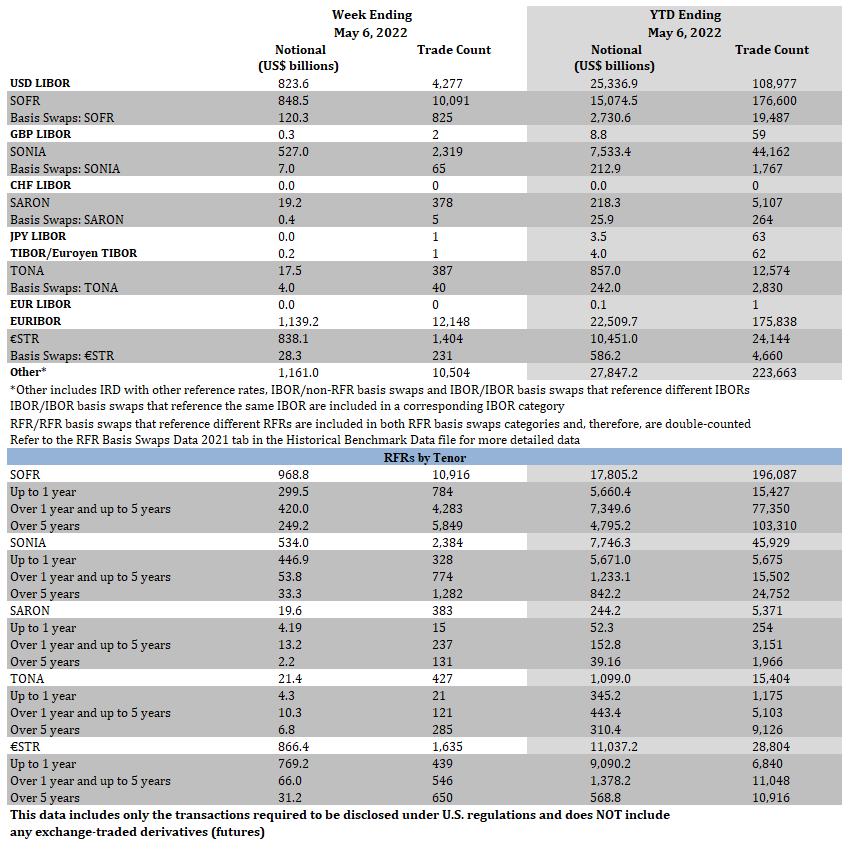
Interest Rate Derivatives: Benchmark Data
Week Ending May 6, 2022
- SOFR traded notional totaled $968.8 billion, including $120.3 billion of basis swaps. Trade count totaled 10.9 thousand, including 825 basis swaps
- SONIA traded notional totaled $534.0 billion, including $7.0 billion of basis swaps. Trade count totaled 2.4 thousand, including 65 basis swaps
- SARON traded notional totaled $19.6 billion, including $0.4 billion of basis swaps. Trade count totaled 383, including 5 basis swaps
- TONA traded notional totaled $21.4 billion, including $4.0 billion of basis swaps. Trade count totaled 427, including 40 basis swaps
- €STR traded notional totaled $866.4 billion, including $28.3 billion of basis swaps. Trade count totaled 1.6 thousand, including 231 basis swaps
YTD Ending May 6, 2022
- SOFR traded notional totaled $17.8 trillion, including $2.7 trillion of basis swaps. Trade count totaled 196.1 thousand, including 19.5 thousand basis swaps
- SONIA traded notional totaled $7.8 trillion, including $212.9 billion of basis swaps. Trade count totaled 45.9 thousand, including 1.8 thousand basis swaps
- SARON traded notional totaled $244.2 billion, including $25.9 billion of basis swaps. Trade count totaled 5.4 thousand, including 264 basis swaps
- TONA traded notional totaled $1.1 trillion, including $242.0 billion of basis swaps. Trade count totaled 15.4 thousand, including 2.8 thousand basis swaps
- €STR traded notional totaled $11.0 trillion, including $586.2 billion of basis swaps. Trade count totaled 28.8 thousand, including 4.7 thousand basis swaps
Click Here to View Historical Benchmark Data
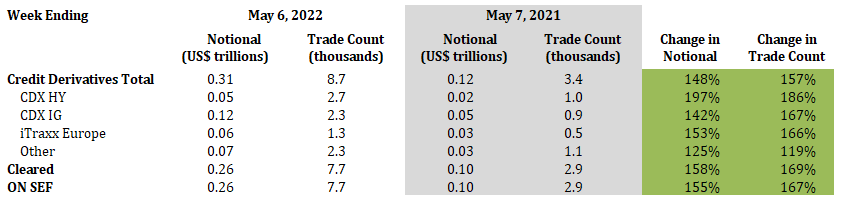
Credit Derivatives
2022 Current Week vs. 2021 Current Week
- Total credit derivatives traded notional and trade count increased by 148% and 157%, respectively
- CDX HY traded notional and trade count increased by 197% and 186%, respectively
- CDX IG traded notional and trade count increased by 142% and 167%, respectively
- iTraxx Europe traded notional and trade count increased by 153% and 166%, respectively
- 84% of total traded notional was cleared vs. 81% last year
- 84% of total traded notional was executed on SEFs vs. 81% last year
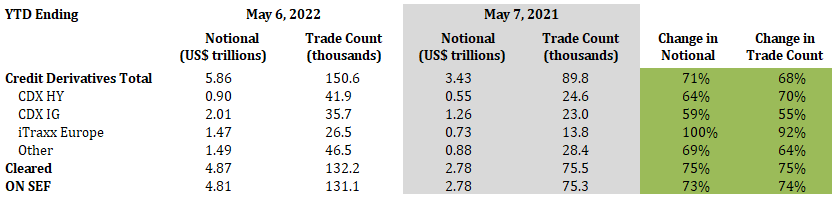
2022 YTD vs. 2021 YTD
- Total credit derivatives traded notional and trade count increased by 71% and 68%, respectively
- CDX HY traded notional and trade count increased by 64% and 70%, respectively
- CDX IG traded notional and trade count increased by 59% and 55%, respectively
- iTraxx Europe traded notional and trade count increased by 100% and 92%, respectively
- 83% of total traded notional was cleared vs. 81% last year
- 82% of total traded notional was executed on SEFs vs. 81% last year