A planned system upgrade by the DTCC SDR on November 21st, 2020 changed reporting logic for the cleared status of trades. Following the upgrade, the percentage of IRD trades indicated to be cleared appeared lower than historical averages as firms switched to the new reporting logic.
ISDA-Clarus RFR Adoption Indicator increased to an all-time high of 11.7% in June compared to 10.8% the prior month. The indicator tracks how much global trading activity (as measured by DV01) is conducted in cleared over-the-counter and exchange-traded interest rate derivatives that reference the identified risk-free rates (RFRs) in six major currencies. The latest June report is available here.
Interest Rate Derivatives
2021 Current Week vs. 2020 Current Week
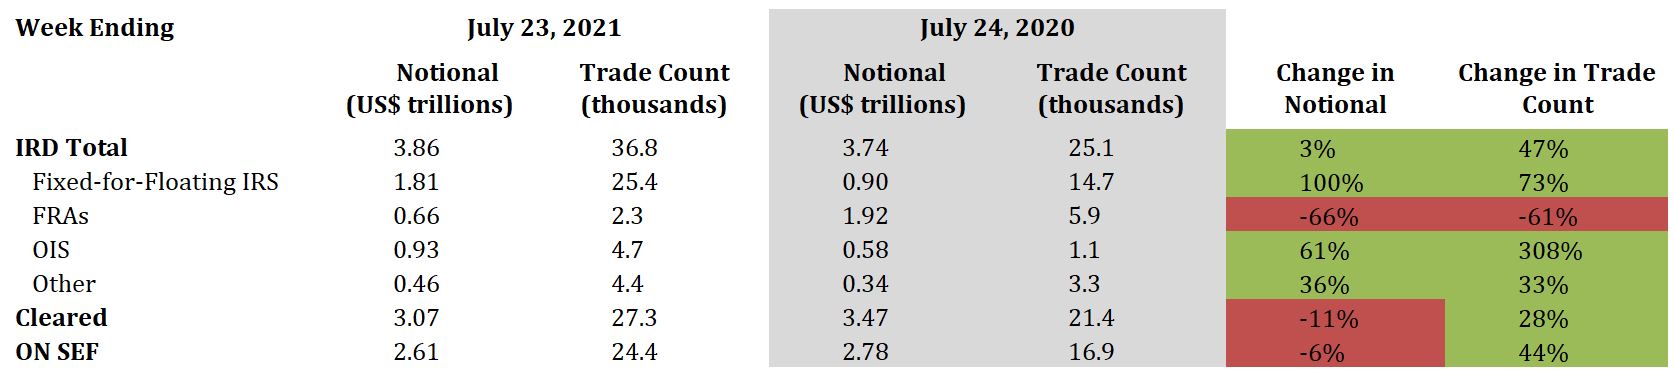
- Total IRD traded notional and trade count increased by 3% and 47%, respectively
- Fixed-for-floating IRS traded notional and trade count increased by 100% and 73%, respectively
- FRAs traded notional and trade count decreased by 66% and 61%, respectively
- OIS traded notional and trade count increased by 61% and 308%, respectively
- 80% of total traded notional was cleared vs. 93% last year
- 68% of total traded notional was executed on SEFs vs. 74% last year
 .
.
2021 YTD vs. 2020 YTD
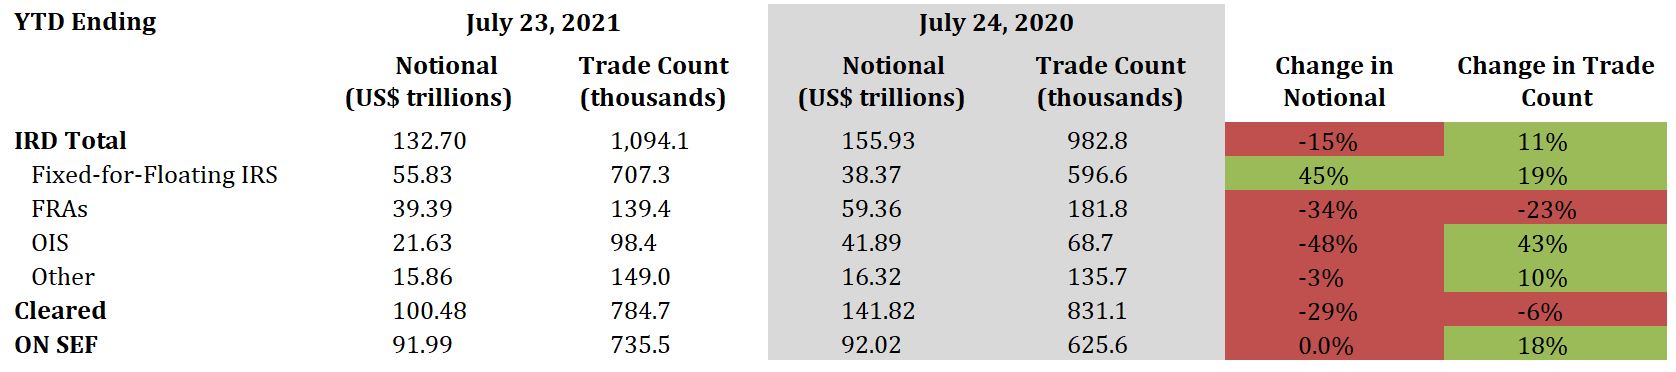
- Total IRD traded notional decreased by 15%, while trade count increased by 11%
- Fixed-for-floating IRS traded notional and trade count increased by 45% and 19%, respectively
- FRAs traded notional and trade count decreased by 34% and 23%, respectively
- OIS traded notional decreased by 48%, while trade count increased by 43%
- 76% of total traded notional was cleared vs. 91% last year
- 69% of total traded notional was executed on SEFs vs. 59% last year
Interest Rate Derivatives: Benchmark Data
Week Ending July 23, 2021
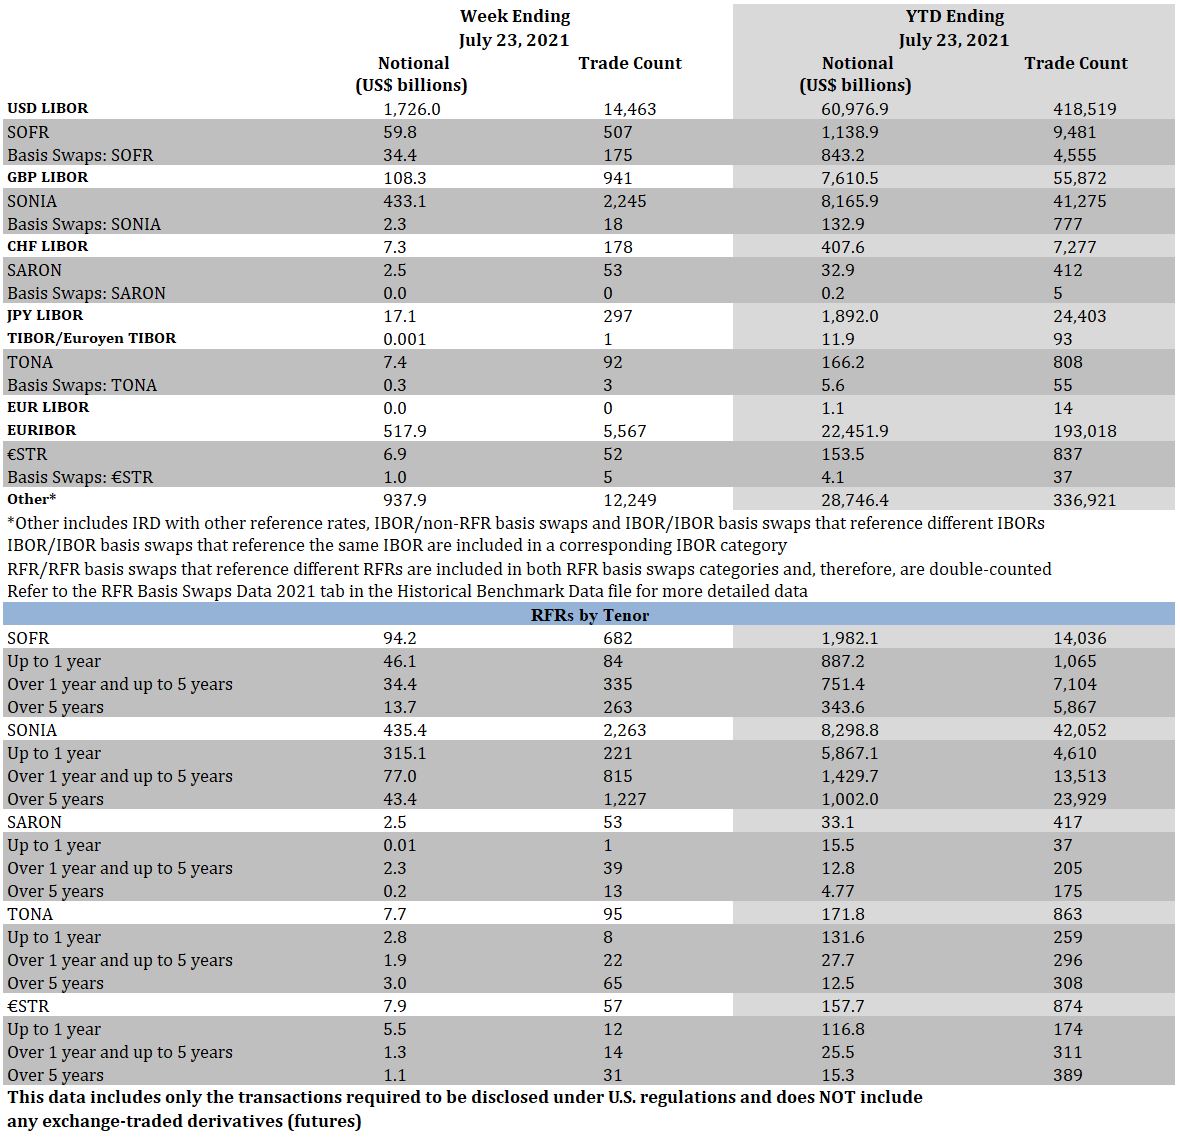
- SOFR traded notional totaled $94.2 billion, including $34.4 billion of basis swaps. Trade count totaled 682, including 175 basis swaps
- SONIA traded notional totaled $435.4 billion, including $2.3 billion of basis swaps. Trade count totaled 2,263, including 18 basis swaps
- SARON traded notional and trade count was $2.5 billion and 53, respectively
- TONA traded notional totaled $7.7 billion, including $0.3 billion of basis swaps. Trade count totaled 95, including 3 basis swaps
- €STR traded notional totaled $7.9 billion, including $1.0 billion of basis swaps. Trade count totaled 57, including 5 basis swaps
YTD Ending July 23, 2021
- SOFR traded notional totaled $2.0 trillion, including $843.2 billion of basis swaps. Trade count totaled 14,036, including 4,555 basis swaps
- SONIA traded notional totaled $8.3 trillion, including $132.9 billion of basis swaps. Trade count totaled 45,052, including 777 basis swaps
- SARON traded notional totaled $33.1 billion, including $0.2 billion of basis swaps. Trade count totaled 417, including 5 basis swaps
- TONA traded notional totaled $171.8 billion, including $5.6 billion of basis swaps. Trade count totaled 863, including 55 basis swaps
- €STR traded notional totaled $157.7 billion, including $4.1 billion of basis swaps. Trade count totaled 874, including 37 basis swaps
Click Here to View Historical Benchmark Data
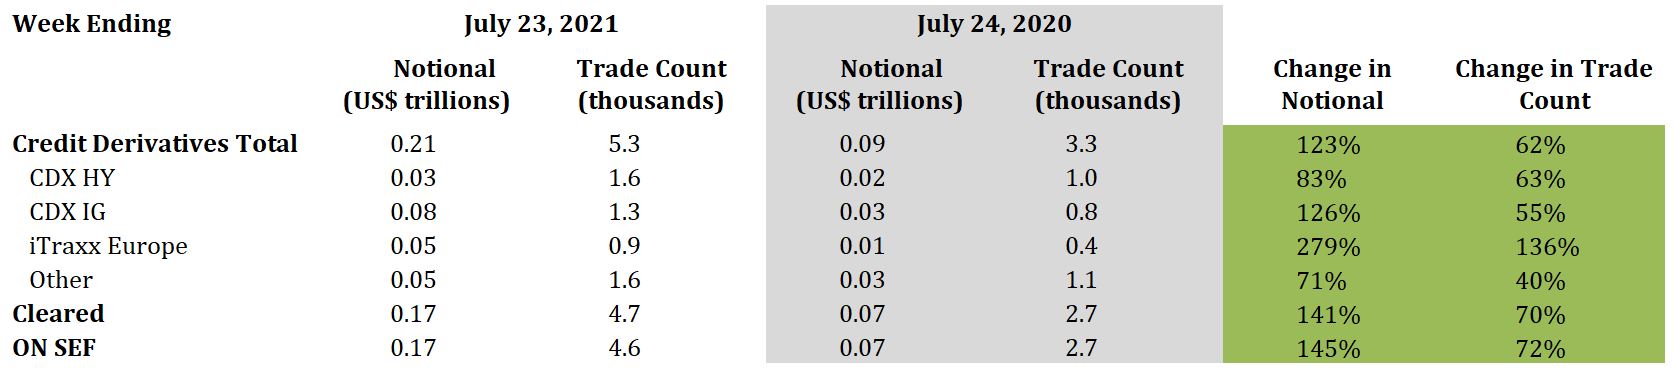
Credit Derivatives
2021 Current Week vs. 2020 Current Week
- Total credit derivatives traded notional and trade count increased by 123% and 62%, respectively
- CDX HY traded notional and trade count increased by 83% and 63%, respectively
- CDX IG traded notional and trade count increased by 126% and 55%, respectively
- iTraxx Europe traded notional and trade count increased by 279% and 136%, respectively
- 83% of total traded notional was cleared vs. 77% last year
- 81% of total traded notional was executed on SEFs vs. 74% last year
2021 YTD vs. 2020 YTD
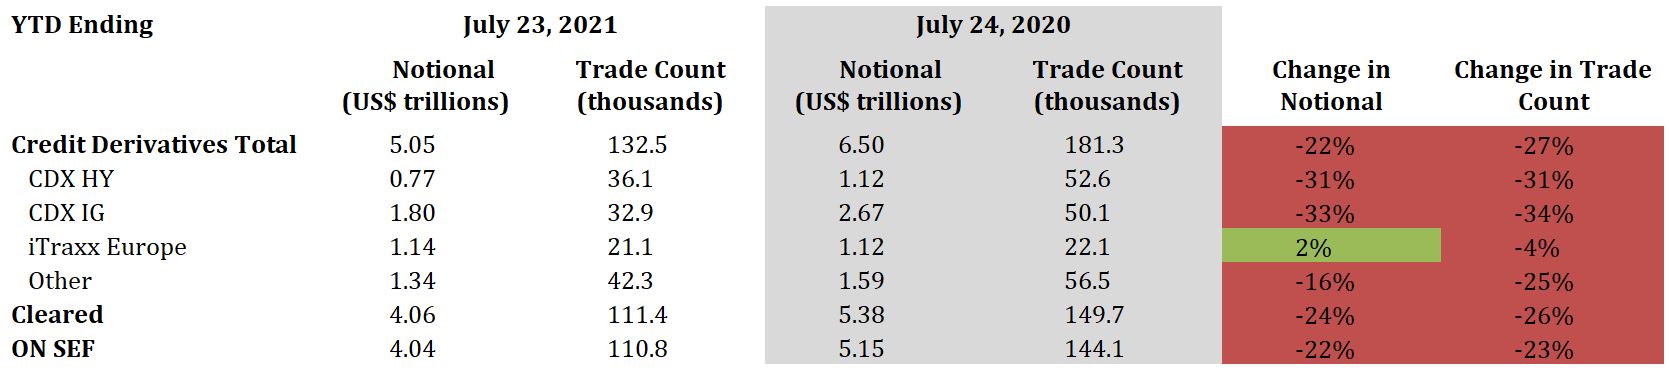
- Total credit derivatives traded notional and trade count decreased by 22% and 27%, respectively
- CDX HY traded notional and trade count both decreased by 31%
- CDX IG traded notional and trade count decreased by 33% and 34%, respectively
- iTraxx Europe traded notional increased by 2%, while trade count decreased by 4%
- 81% of total traded notional was cleared vs. 83% last year
- 80% of total traded notional was executed on SEFs vs. 79% last year