Interest Rate Derivatives
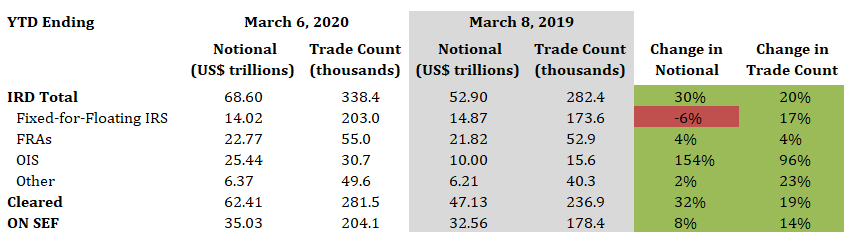
2020 YTD vs. 2019 YTD
- Total IRD traded notional and trade count increased by 30% and 20%, respectively
- Fixed-for-floating IRS traded notional decreased by 6%, while trade count increased by 17%
- FRAs traded notional and trade count both increased by 4%
- OIS traded notional and trade count increased by 154% and 96%, respectively
- 91% of total traded notional was cleared vs. 89% last year
- 51% of total traded notional was executed On SEF vs. 62% last year
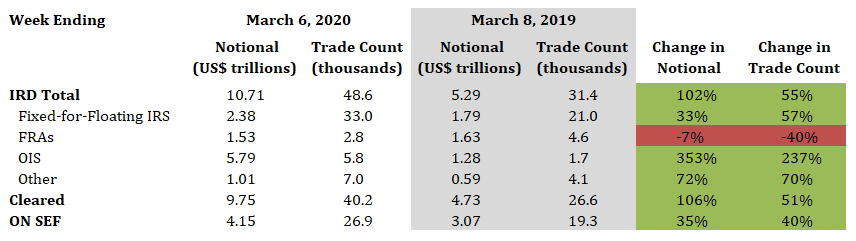
2020 Current Week vs. 2019 Current Week
- Total IRD traded notional and trade count increased by 102% and 55%, respectively
- Fixed-for-floating IRS traded notional and trade count increased by 33% and 57%, respectively
- FRAs traded notional and trade count decreased by 7% and 40%, respectively
- OIS traded notional and trade count increased by 353% and 237%, respectively
- 91% of total traded notional was cleared vs. 89% last year
- 39% of total traded notional executed On SEF vs. 58% last year
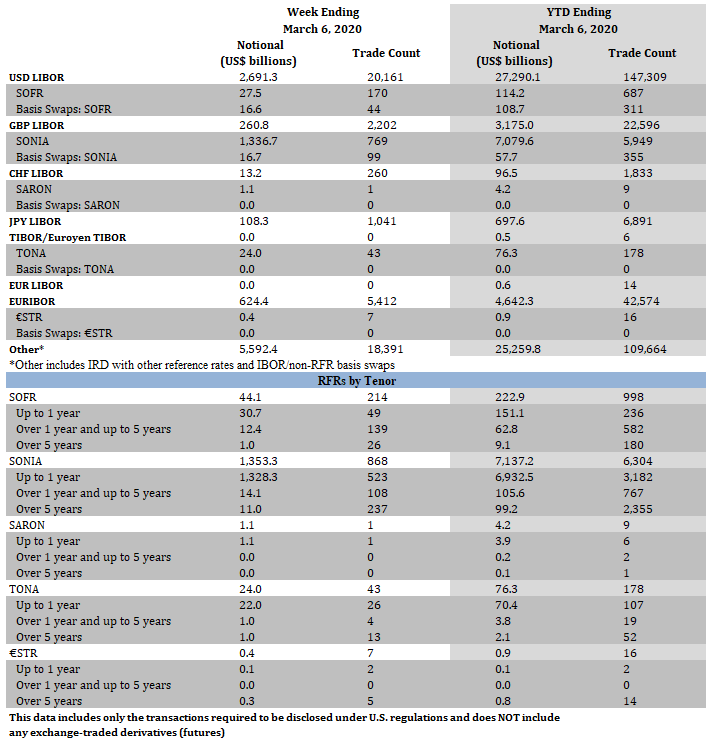
Interest Rate Derivatives: Benchmark Data
Week Ending March 6, 2020
- SOFR traded notional totaled $44.1 billion, including $16.6 billion of basis swaps. Trade count totaled 214, including 44 basis swaps
- SONIA traded notional totaled $1.4 trillion, including $16.7 billion of basis swaps. Trade count totaled 868, including 99 basis swaps
- SARON traded notional and trade count was $1.1 billion and 1, respectively
- TONA traded notional and trade count was $24.0 billion and 43, respectively
- €STR traded notional and trade count was $0.4 billion and 7, respectively
YTD Ending March 6, 2020
- SOFR traded notional totaled $222.9 billion, including $108.7 billion of basis swaps. Trade count totaled 998, including 311 basis swaps
- SONIA traded notional totaled $7.1 trillion, including $57.7 billion of basis swaps. Trade count totaled 6,304, including 355 basis swaps
- SARON traded notional and trade count was $4.2 billion and 9, respectively
- TONA traded notional and trade count was $76.3 billion and 178, respectively
- €STR traded notional and trade count was $0.9 billion and 16, respectively
Click Here to View Historical Benchmark Data
Credit Derivatives
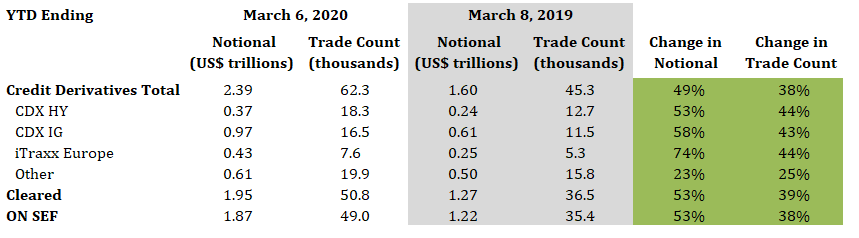
2020 YTD vs. 2019 YTD
- Total credit derivatives traded notional and trade count increased by 49% and 38%, respectively
- CDX HY traded notional and trade count increased by 53% and 44%, respectively
- CDX IG traded notional and trade count increased by 58% and 43%, respectively
- iTraxx Europe traded notional and trade count increased by 74% and 44%, respectively
- 82% of total traded notional was cleared vs. 79% last year
- 78% of total traded notional was executed On SEF vs.76% last year
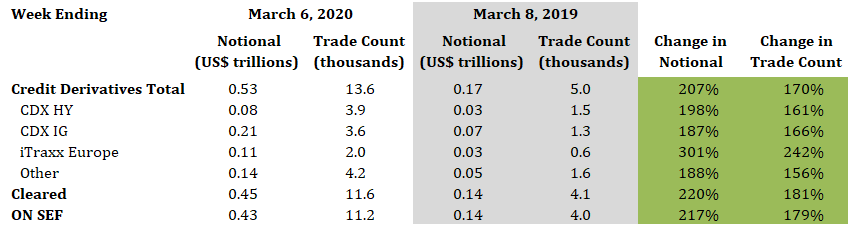
2020 Current Week vs. 2019 Current Week
- Total credit derivatives traded notional and trade count increased by 207% and 170%, respectively
- CDX HY traded notional and trade count increased by 198% and 161%, respectively
- CDX IG traded notional and trade count increased by 187% and 166%, respectively
- iTraxx Europe traded notional and trade count increased by 301% and 242%, respectively
- 84% of total traded notional was cleared vs. 81% last year
- 80% of total traded notional executed On SEF vs. 78% last year