Interest Rate Derivatives
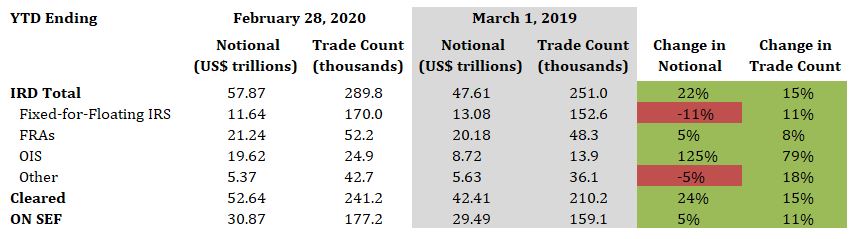
2020 YTD vs. 2019 YTD
- Total IRD traded notional and trade count increased by 22% and 15%, respectively
- Fixed-for-floating IRS traded notional decreased by 11%, while trade count increased by 11%
- FRAs traded notional and trade count increased by 5% and 8%, respectively
- OIS traded notional and trade count increased by 125% and 79%, respectively
- 91% of total traded notional was cleared vs. 89% last year
- 53% of total traded notional was executed On SEF vs. 62% last year
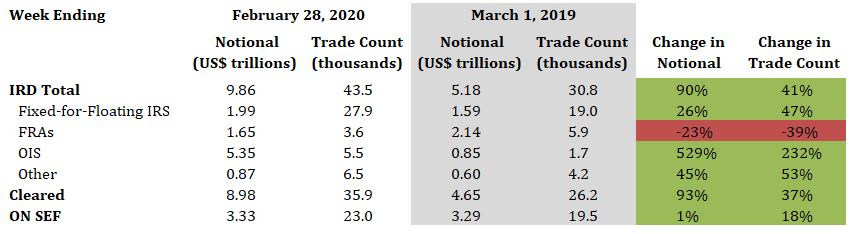
2020 Current Week vs. 2019 Current Week
- Total IRD traded notional and trade count increased by 90% and 41%, respectively
- Fixed-for-floating IRS traded notional and trade count increased by 26% and 47%, respectively
- FRAs traded notional and trade count decreased by 23% and 39%, respectively
- OIS traded notional and trade count increased by 529% and 232%, respectively
- 91% of total traded notional was cleared vs. 90% last year
- 34% of total traded notional executed On SEF vs. 64% last year
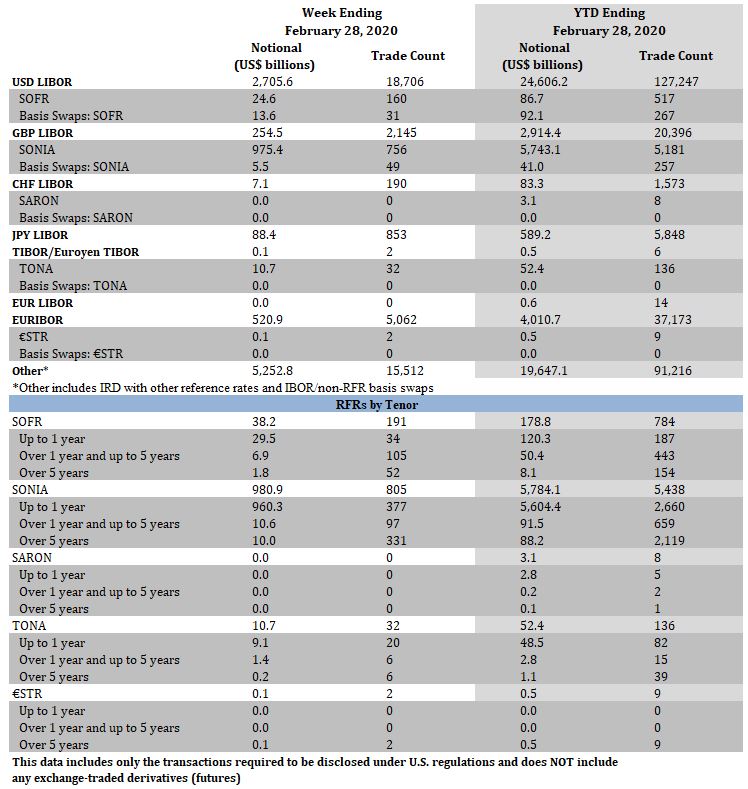
Interest Rate Derivatives: Benchmark Data
Week Ending February 28, 2020
- SOFR traded notional totaled $38.2 billion, including $13.6 billion of basis swaps. Trade count totaled 191, including 31 basis swaps
- SONIA traded notional totaled $980.9 billion, including $5.5 billion of basis swaps. Trade count totaled 805, including 49 basis swaps
- There were no SARON trades
- TONA traded notional and trade count was $10.7 billion and 32, respectively
- €STR traded notional and trade count was $0.1 billion and 2, respectively
YTD Ending February 28, 2020
- SOFR traded notional totaled $178.8 billion, including $92.1 billion of basis swaps. Trade count totaled 784, including 267 basis swaps
- SONIA traded notional totaled $5.8 trillion, including $41.0 billion of basis swaps. Trade count totaled 5,438, including 257 basis swaps
- SARON traded notional and trade count was $3.1 billion and 8, respectively
- TONA traded notional and trade count was $52.4 billion and 136, respectively
- €STR traded notional and trade count was $0.5 billion and 9, respectively
Click Here to View Historical Benchmark Data
Credit Derivatives
2020 YTD vs. 2019 YTD
- Total credit derivatives traded notional and trade count increased by 30% and 21%, respectively
- CDX HY traded notional and trade count increased by 35% and 29%, respectively
- CDX IG traded notional and trade count increased by 41% and 27%, respectively
- iTraxx Europe traded notional and trade count increased by 46% and 20%, respectively
- 81% of total traded notional was cleared vs. 79% last year
- 78% of total traded notional was executed On SEF vs.76% last year

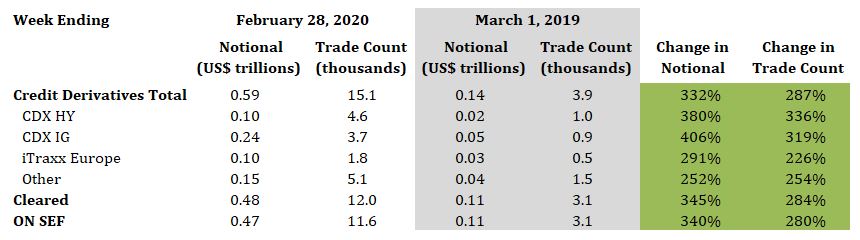
2020 Current Week vs. 2019 Current Week
- Total credit derivatives traded notional and trade count increased by 332% and 287%, respectively
- CDX HY traded notional and trade count increased by 380% and 336%, respectively
- CDX IG traded notional and trade count increased by 406% and 319%, respectively
- iTraxx Europe traded notional and trade count increased by 291% and 226%, respectively
- 82% of total traded notional was cleared vs. 80% last year
- 79% of total traded notional executed On SEF vs. 78% last year