Interest Rate Derivatives
2020 YTD vs. 2019 YTD
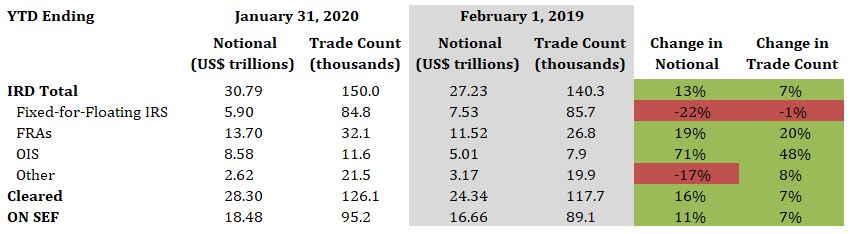
- Total IRD traded notional and trade count increased by 13% and 7%, respectively
- Fixed-for-floating IRS traded notional and trade count decreased by 22% and 1%, respectively
- FRAs traded notional and trade count increased by 19% and 20%, respectively
- OIS traded notional and trade count increased by 71% and 48%, respectively
- 92% of total traded notional was cleared vs. 89% last year
- 60% of total traded notional was executed On SEF vs. 61% last year
2020 Current Week vs. 2019 Current Week
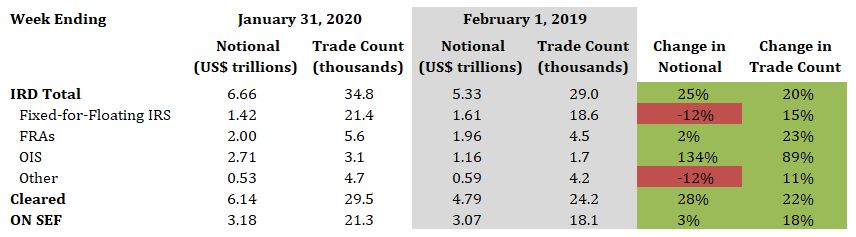
- Total IRD traded notional and trade count increased by 25% and 20%, respectively
- Fixed-for-floating IRS traded notional decreased by 12%, while trade count increased by 15%
- FRAs traded notional and trade count increased by 2% and 23%, respectively
- OIS traded notional and trade count increased by 134% and 89%, respectively
- 92% of total traded notional was cleared vs. 90% last year
- 48% of total traded notional executed On SEF vs. 58% last year
Interest Rate Derivatives: Benchmark Data
Week Ending January 31, 2020
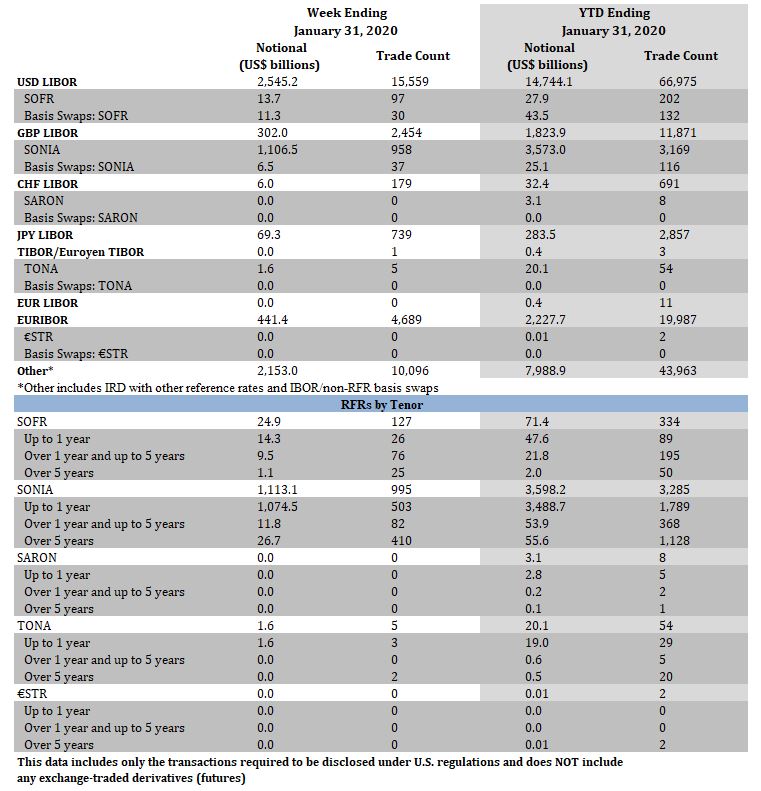
- SOFR traded notional totaled $24.9 billion, including $11.3 billion of basis swaps. Trade count totaled 127, including 30 basis swaps
- SONIA traded notional totaled $1.1 trillion, including $6.5 billion of basis swaps. Trade count totaled 995, including 37 basis swaps
- There were no SARON trades
- TONA traded notional and trade count was $1.6 billion and 5, respectively
- There were no €STR trades
YTD Ending January 31, 2020
- SOFR traded notional totaled $71.4 billion, including $43.5 billion of basis swaps. Trade count totaled 334, including 132 basis swaps
- SONIA traded notional totaled $3.6 trillion, including $25.1 billion of basis swaps. Trade count totaled 3,285, including 116 basis swaps
- SARON traded notional and trade count was $3.1 billion and 8, respectively
- TONA traded notional and trade count was $20.1 billion and 54, respectively
- €STR traded notional and trade count was $10 million and 2, respectively
Click Here to View Historical Benchmark Data
Credit Derivatives
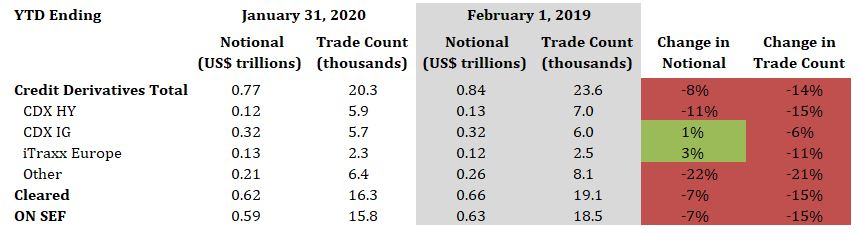
2020 YTD vs. 2019 YTD
- Total credit derivatives traded notional and trade count decreased by 8% and 14%, respectively
- CDX HY traded notional and trade count decreased by 11% and 15%, respectively
- CDX IG traded notional increased by 1%, while trade count decreased by 6%
- iTraxx Europe traded notional increased by 3%, while trade count decreased by 11%
- 80% of total traded notional was cleared vs. 79% last year
- 76% of total traded notional was executed On SEF vs.75% last year
2020 Current Week vs. 2019 Current Week
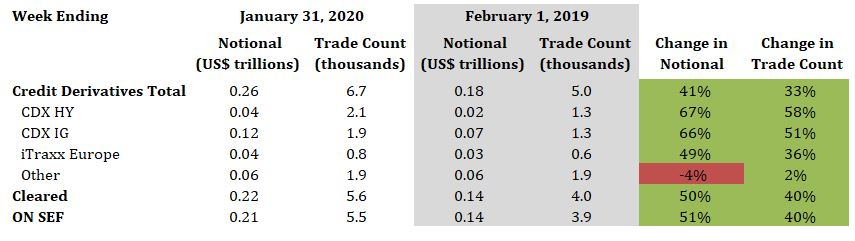
- Total credit derivatives traded notional and trade count increased by 41% and 33%, respectively
- CDX HY traded notional and trade count increased by 67% and 58%, respectively
- CDX IG traded notional and trade count increased by 66% and 51%, respectively
- iTraxx Europe traded notional and trade count increased by 49% and 36%, respectively
- 83% of total traded notional was cleared vs. 79% last year
- 80% of total traded notional was executed On SEF vs. 75% last year