Interest Rate Derivatives
2020 YTD vs. 2019 YTD
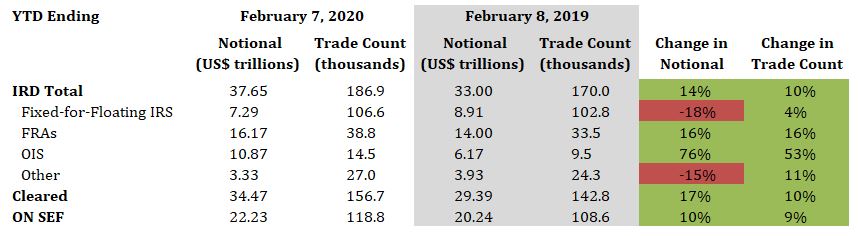
- Total IRD traded notional and trade count increased by 14% and 10%, respectively
- Fixed-for-floating IRS traded notional decreased by 18%, while trade count increased by 4%
- FRAs traded notional and trade count both increased by 16%
- OIS traded notional and trade count increased by 76% and 53%, respectively
- 92% of total traded notional was cleared vs. 89% last year
- 59% of total traded notional was executed On SEF vs. 61% last year
2020 Current Week vs. 2019 Current Week
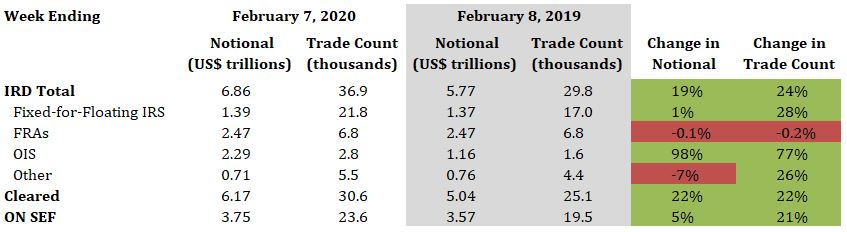
- Total IRD traded notional and trade count increased by 19% and 24%, respectively
- Fixed-for-floating IRS traded notional and trade count increased by 1% and 28%, respectively
- FRAs traded notional and trade count decreased by 0.1% and 0.2%, respectively
- OIS traded notional and trade count increased by 98% and 77%, respectively
- 90% of total traded notional was cleared vs. 87% last year
- 55% of total traded notional executed On SEF vs. 62% last year
Interest Rate Derivatives: Benchmark Data
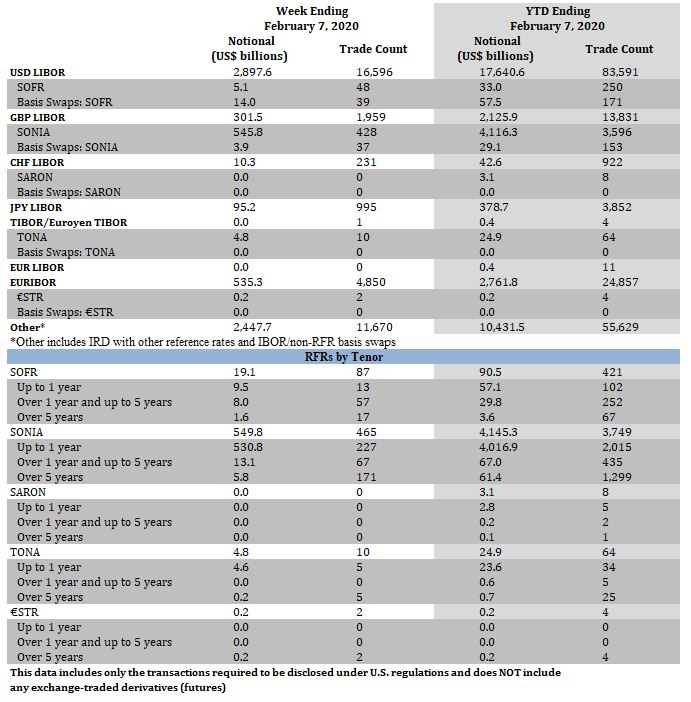
Week Ending February 7, 2020
- SOFR traded notional totaled $19.1 billion, including $14.0 billion of basis swaps. Trade count totaled 87, including 39 basis swaps
- SONIA traded notional totaled $549.8 billion, including $3.9 billion of basis swaps. Trade count totaled 465, including 37 basis swaps
- There were no SARON trades
- TONA traded notional and trade count was $4.8 billion and 10, respectively
- €STR traded notional and trade count was $0.2 billion and 2, respectively
YTD Ending February 7, 2020
- SOFR traded notional totaled $90.5 billion, including $57.5 billion of basis swaps. Trade count totaled 421, including 171 basis swaps
- SONIA traded notional totaled $4.1 trillion, including $29.1 billion of basis swaps. Trade count totaled 3,749, including 153 basis swaps
- SARON traded notional and trade count was $3.1 billion and 8, respectively
- TONA traded notional and trade count was $24.9 billion and 64, respectively
- €STR traded notional and trade count was $0.2 billion and 4, respectively
Click Here to View Historical Benchmark Data
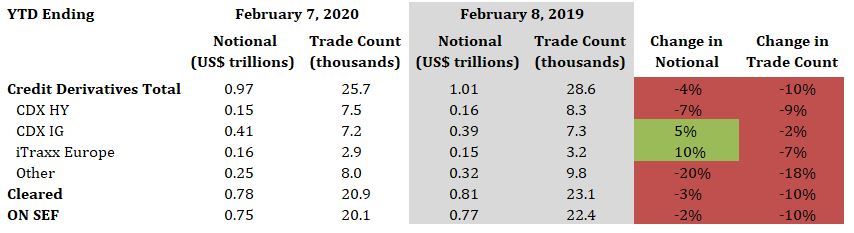
Credit Derivatives
2020 YTD vs. 2019 YTD
- Total credit derivatives traded notional and trade count decreased by 4% and 10%, respectively
- CDX HY traded notional and trade count decreased by 7% and 9%, respectively
- CDX IG traded notional increased by 5%, while trade count decreased by 2%
- iTraxx Europe traded notional increased by 10%, while trade count decreased by 7%
- 81% of total traded notional was cleared vs. 80% last year
- 77% of total traded notional was executed On SEF vs.76% last year
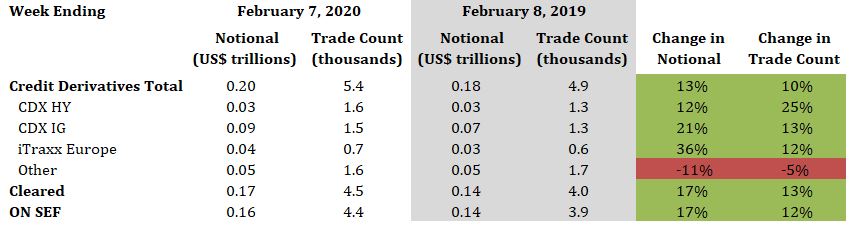
2020 Current Week vs. 2019 Current Week
- Total credit derivatives traded notional and trade count increased by 13% and 10%, respectively
- CDX HY traded notional and trade count increased by 12% and 25%, respectively
- CDX IG traded notional and trade count increased by 21% and 13%, respectively
- iTraxx Europe traded notional and trade count increased by 36% and 12%, respectively
- 84% of total traded notional was cleared vs. 81% last year
- 81% of total traded notional was executed On SEF vs. 78% last year