Interest Rate Derivatives
2019 YTD vs. 2018 YTD
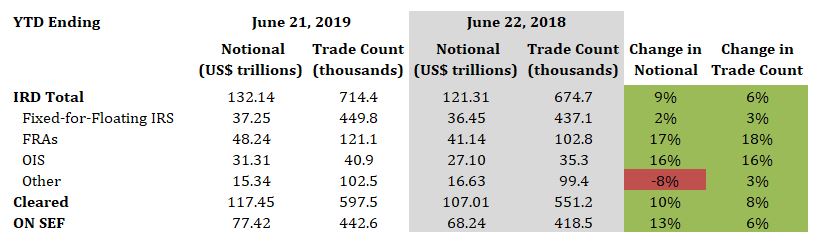
- Total IRD traded notional and trade count increased by 9% and 6%, respectively
- Fixed-for-floating IRS traded notional and trade count increased by 2% and 3%, respectively
- FRAs traded notional and trade count increased by 17% and 18%, respectively
- OIS traded notional and trade count both increased by 16%
- 89% of total traded notional was cleared vs. 88% last year
- 59% of total traded notional was executed On SEF vs. 56% last year
2019 Current Week vs. 2018 Current Week
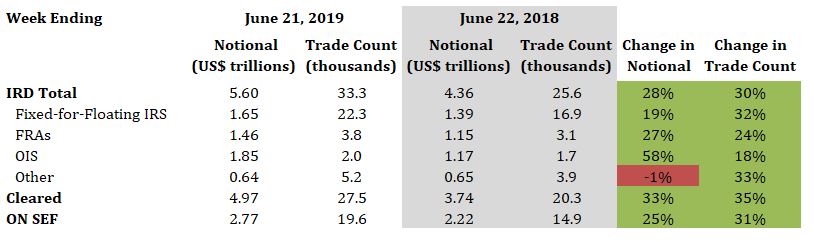
- Total IRD traded notional and trade count increased by 28% and 30%, respectively
- Fixed-for-floating IRS traded notional and trade count increased by 19% and 32%, respectively
- FRAs traded notional and trade count increased by 27% and 24%, respectively
- OIS traded notional and trade count increased by 58% and 18%, respectively
- 89% of total traded notional was cleared vs. 86% last year
- 50% of total traded notional was executed On SEF vs. 51% last year
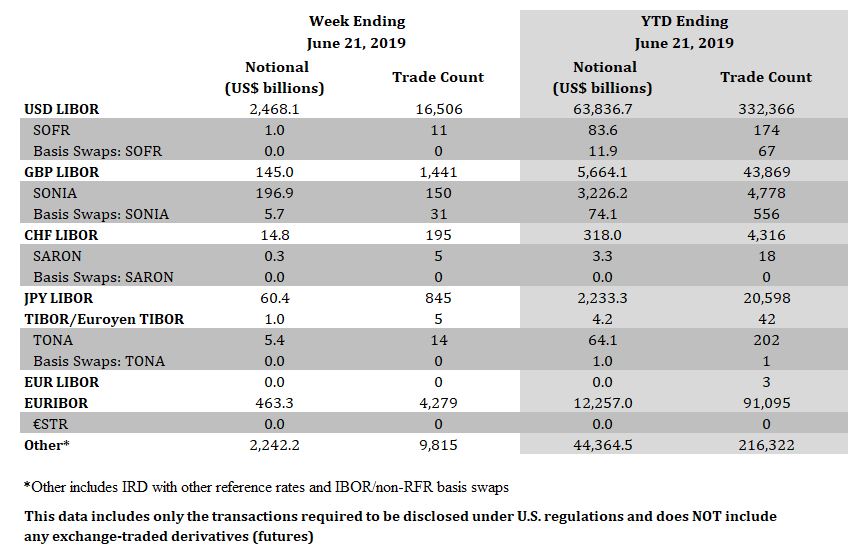
Interest Rate Derivatives: Benchmark Data
Week Ending June 21, 2019
- SOFR traded notional and trade count was $1.0 billion and 11, respectively
- SONIA traded notional totaled $202.6 billion, including $5.7 billion of basis swaps. Trade count totaled 181, including 31 basis swaps
- SARON traded notional and trade count was $0.3 billion and 5, respectively
- TONA traded notional and trade count was $5.4 billion and 14, respectively
YTD Ending June 21, 2019
- SOFR traded notional totaled $95.5 billion, including $11.9 billion of basis swaps. Trade count totaled 241, including 67 basis swaps
- SONIA traded notional totaled $3.3 trillion, including $74.1 billion of basis swaps. Trade count totaled 5,334, including 556 basis swaps
- SARON traded notional and trade count was $3.3 billion and 18, respectively
- TONA traded notional totaled $65.1 billion, including $1.0 billion of basis swaps. Trade count totaled 203, including 1 basis swap
Click Here to View Historical Benchmark Data
Credit Derivatives
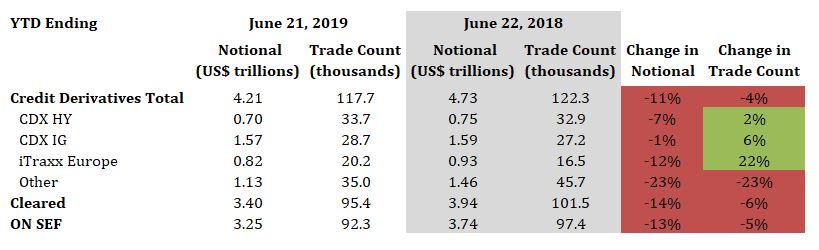
2019 YTD vs. 2018 YTD
- Total credit derivatives traded notional and trade count decreased by 11% and 4%, respectively
- CDX HY traded notional decreased by 7%, while trade count increased by 2%
- CDX IG traded notional decreased by 1%, while trade count increased by 6%
- iTraxx Europe traded notional decreased by 12%, while trade count increased by 22%
- 81% of total traded notional was cleared vs. 83% last year
- 77% of total traded notional was executed On SEF vs. 79% last year
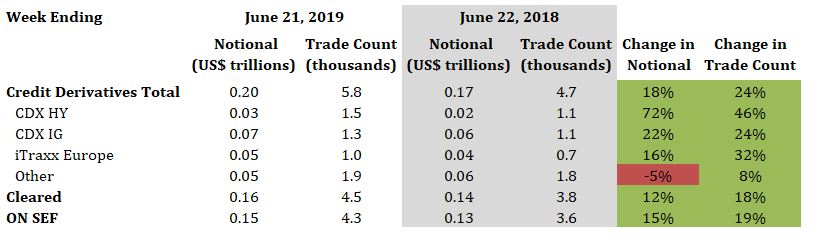
2019 Current Week vs. 2018 Current Week
- Total credit derivatives traded notional and trade count increased by 18% and 24%, respectively
- CDX HY traded notional and trade count increased by 72% and 46%, respectively
- CDX IG traded notional and trade count increased by 22% and 24%, respectively
- iTraxx Europe traded notional and trade count increased by 16% and 32%, respectively
- 78% of total traded notional was cleared vs. 82% last year
- 75% of total traded notional was executed On SEF vs. 77% last year